EtBr and DNase colony biofilm experiments
Scott Saunders
10_22_19
library(tidyverse)
library(cowplot)
library(viridis)
library(knitr)
library(kableExtra)


knitr::opts_chunk$set(tidy.opts=list(width.cutoff=60),tidy=TRUE, echo = TRUE, message=FALSE, warning=FALSE, fig.align="center", fig.retina = 2)

source("../../IDA/tools/plotting_tools.R")

theme_set(theme_1())
Intro
This experiment is a follow up to several other attempted experiments to perturb the DNA bound phenazines in colony biofilms. We tried to treat biofilms with DNase 1 in he underlying agar to chop up the eDNA into smaller pieces. This was somewhat successful when DNase was not incubated in its NEB buffer, which killed the cells. However, the effects were modest, so I tried repeating the experiment with DNase in PBS supplemented with Mg2+, which should further activate the enzyme. Further, I wanted to try the experiment on WT and ∆pelB colonies, since we think that Pel may be binding eDNA and blocking PYO binding sites it may also interfere with the activity of the DNase…?
I have also tried perturbing colony retained phenazines with a competitive intercalator ethidium (also tried propidium). This experiment has worked reasonably well multiple times, although it is complicated to displace WT phenazines, since the cells just seem to make more. Recently I tried exposing ∆phz* to phenazine and an etbr competitor simultaneously and it worked well. However, I only had duplicate measurements and I did not test PCA (only PYO and PCN). Therefore I wanted triplicates this time and also expose to PCA.
Methods
Colonies were grown as normal in 6 well plates on 0.2um filter membranes atop agar, incubated in the dark at room temperature. Images were taken on the keyence on days 3 and 4.
EtBr
∆phz* colonies were inoculated on top of plate wells containing different concentrations of ethidium bromide (etbr) and constant concentrations of phenazines (50uM). The concentrations of etbr used were 0, 10, 100, and 500. Each well contained 500uL of liquid (in PBS 50) added to the bottom before agar was poured on top and mixed.
10mM etbr stock was prepared and filter sterilized. It was diluted 5 fold and then 10 fold to yield 3 different stock solutions of 10mM, 2mM, and 200uM. Each of those stocks was 20x the intended final concentration, so 250uL of each was added to the appropriate well (or PBS only). Then each phenazine (50uM) was added to the wells (~10 - 40uL) and the remaining volume was made up with PBS 50.
Plates were prepared and dried for 1 hr in the biosafety cabinet.
Phenazine stocks were 10mM for PCA in NaOH, 20mM for PCN in DMSO, and 6.79mM for PYO in HCl.
DNase
Six Parsek WT colonies and six ∆pelB colonies were grown as usual for three days. For 24 hours, colonies were transferred to fresh agar plate wells containing 25uL DNase or buffer only. The DNase / buffer solutions were allowed to dry for ~5 min, but were still liquid pools on the surface of the agar.
The Buffer was PBS 137mM NaCl pH 7.2 + 5mM MgSO4.
Extractions
Colonies were resuspended in 800uL PBS 137 (pH 7.2) in eppendorf tubes. Tubes with filter membranes + colonies were vortexed for 1 min each at max speed. This was sufficient to resuspend most of the colonies into a cloudy haze and small bits of biofilm. However for colonies treated with 100uM or 500uM EtBr, the colonies were very tough and the vortex was not sufficient. Next all the membranes were removed from the tubes, and for the colonies that did not come off the membranes they were moved (biofilm + membrane) to a petri dish and the intact biofilm mass was removed from the membrane with tweezers and placed back in the tube.
*Note the PCA treated colonies were treated in the water bath sonicator on high for 5 min in an attempt to resuspend them better. This was not successful and was not performed on the PCN and PYO samples.
The volume of liquid in each tube was measured by pipette. The DNase colonies were easy to resuspend and a p200 was used. The etbr were more difficult to resuspend, so a p1000 was used to grind and further break up the biofilm by pipetting up and down and the volume of that slurry was measured (crudely) in the p1000 (starting from 850uL pipette volume).
Finally all of the biofilm suspensions were centrifuged at 6,000 rcf for 5 min to pellet the cells. 650uL of the supernatant was transferred to fresh tubes. The etbr treated samples had obviously red liquids at 100 and 500uM.
LC-MS
Extracts were defrosted and vortexed briefly before being transferred into spin-X filter columns (600uL). Filter columns were spun at max speed (~16k rcf) for 1.5min. Samples were diluted two fold in LC-MS sample vials (500uL sample + 500uL PBS 137).
Samples were run and processed using the standard method. MS channels were acquired.
Results
First let’s look at the colony volumes to see if there are large differences in colony sizes that may skew our results. Remember these data were acquired simply by pipetting up the entire solution and measuring the volume crudely with a pipette. That means the measurements were extremely susceptible to bubbles that rise to the top of the solution and displace volume that wasn’t due to liquid.
df_vol <- read_csv("data/2019_10_22_colony_volumes.csv")

df_vol %>% kable() %>% kable_styling() %>% scroll_box(height = "300px")| strain | treatment | phz_added | etbr_added_uM | Replicate | Measured_Volume |
|---|---|---|---|---|---|
| ∆pelB | none | NA | NA | 1 | 700 |
| ∆pelB | none | NA | NA | 2 | 719 |
| ∆pelB | none | NA | NA | 3 | 689 |
| ∆pelB | dnase | NA | NA | 1 | 725 |
| ∆pelB | dnase | NA | NA | 2 | 733 |
| ∆pelB | dnase | NA | NA | 3 | 711 |
| ParWT | none | NA | NA | 1 | 737 |
| ParWT | none | NA | NA | 2 | 771 |
| ParWT | none | NA | NA | 3 | 742 |
| ParWT | dnase | NA | NA | 1 | 735 |
| ParWT | dnase | NA | NA | 2 | 726 |
| ParWT | dnase | NA | NA | 3 | 771 |
| dPHZstar | etbr | PCA | 0uM | 1 | 766 |
| dPHZstar | etbr | PCA | 0uM | 2 | 750 |
| dPHZstar | etbr | PCA | 0uM | 3 | 774 |
| dPHZstar | etbr | PCA | 10uM | 1 | 780 |
| dPHZstar | etbr | PCA | 10uM | 2 | 780 |
| dPHZstar | etbr | PCA | 10uM | 3 | 790 |
| dPHZstar | etbr | PCA | 100uM | 1 | 795 |
| dPHZstar | etbr | PCA | 100uM | 2 | 760 |
| dPHZstar | etbr | PCA | 100uM | 3 | 790 |
| dPHZstar | etbr | PCA | 500uM | 1 | 702 |
| dPHZstar | etbr | PCA | 500uM | 2 | 718 |
| dPHZstar | etbr | PCA | 500uM | 3 | 709 |
| dPHZstar | etbr | PCN | 0uM | 1 | 765 |
| dPHZstar | etbr | PCN | 0uM | 2 | 760 |
| dPHZstar | etbr | PCN | 0uM | 3 | 810 |
| dPHZstar | etbr | PCN | 10uM | 1 | 765 |
| dPHZstar | etbr | PCN | 10uM | 2 | 752 |
| dPHZstar | etbr | PCN | 10uM | 3 | 690 |
| dPHZstar | etbr | PCN | 100uM | 1 | 774 |
| dPHZstar | etbr | PCN | 100uM | 2 | 738 |
| dPHZstar | etbr | PCN | 100uM | 3 | 760 |
| dPHZstar | etbr | PCN | 500uM | 1 | NA |
| dPHZstar | etbr | PCN | 500uM | 2 | 720 |
| dPHZstar | etbr | PCN | 500uM | 3 | 670 |
| dPHZstar | etbr | PYO | 0uM | 1 | 780 |
| dPHZstar | etbr | PYO | 0uM | 2 | 770 |
| dPHZstar | etbr | PYO | 0uM | 3 | 770 |
| dPHZstar | etbr | PYO | 10uM | 1 | 800 |
| dPHZstar | etbr | PYO | 10uM | 2 | 785 |
| dPHZstar | etbr | PYO | 10uM | 3 | 795 |
| dPHZstar | etbr | PYO | 100uM | 1 | 785 |
| dPHZstar | etbr | PYO | 100uM | 2 | 725 |
| dPHZstar | etbr | PYO | 100uM | 3 | 735 |
| dPHZstar | etbr | PYO | 500uM | 1 | 744 |
| dPHZstar | etbr | PYO | 500uM | 2 | 715 |
| dPHZstar | etbr | PYO | 500uM | 3 | 735 |
First let’s look at the DNase treated colonies:
ggplot(df_vol %>% filter(treatment != "etbr"), aes(x = strain,
    y = Measured_Volume, fill = treatment)) + geom_jitter(shape = 21,
    width = 0.1)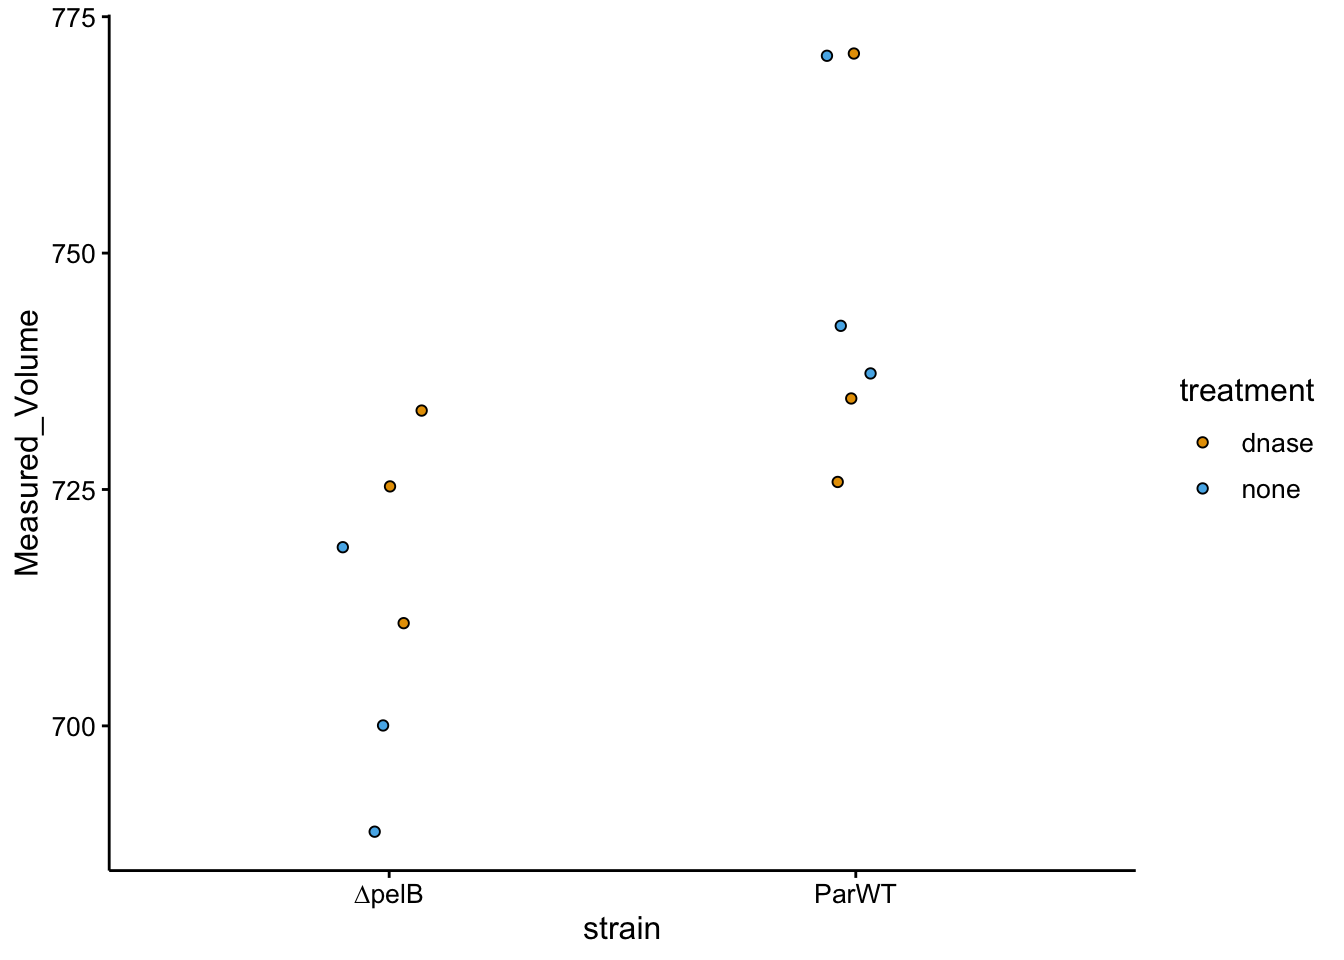
You can see that there’s a lot of overlap between the treated and untreated colonies, however, the WT colonies may be slightly larger overall. Doesn’t seem like volume will be an issue, which makes sense since the colonies look pretty identical.
Now let’s look at the ethidium treated colonies:
df_vol$etbr_added_uM = factor(df_vol$etbr_added_uM)

levels(df_vol$etbr_added_uM) = c("0uM", "10uM", "100uM", "500uM")

ggplot(df_vol %>% filter(treatment == "etbr"), aes(x = etbr_added_uM,
    y = Measured_Volume, fill = etbr_added_uM)) + geom_jitter(shape = 21,
    width = 0.1) + facet_wrap(~phz_added, scales = "free") +
    scale_fill_viridis_d(guide = F)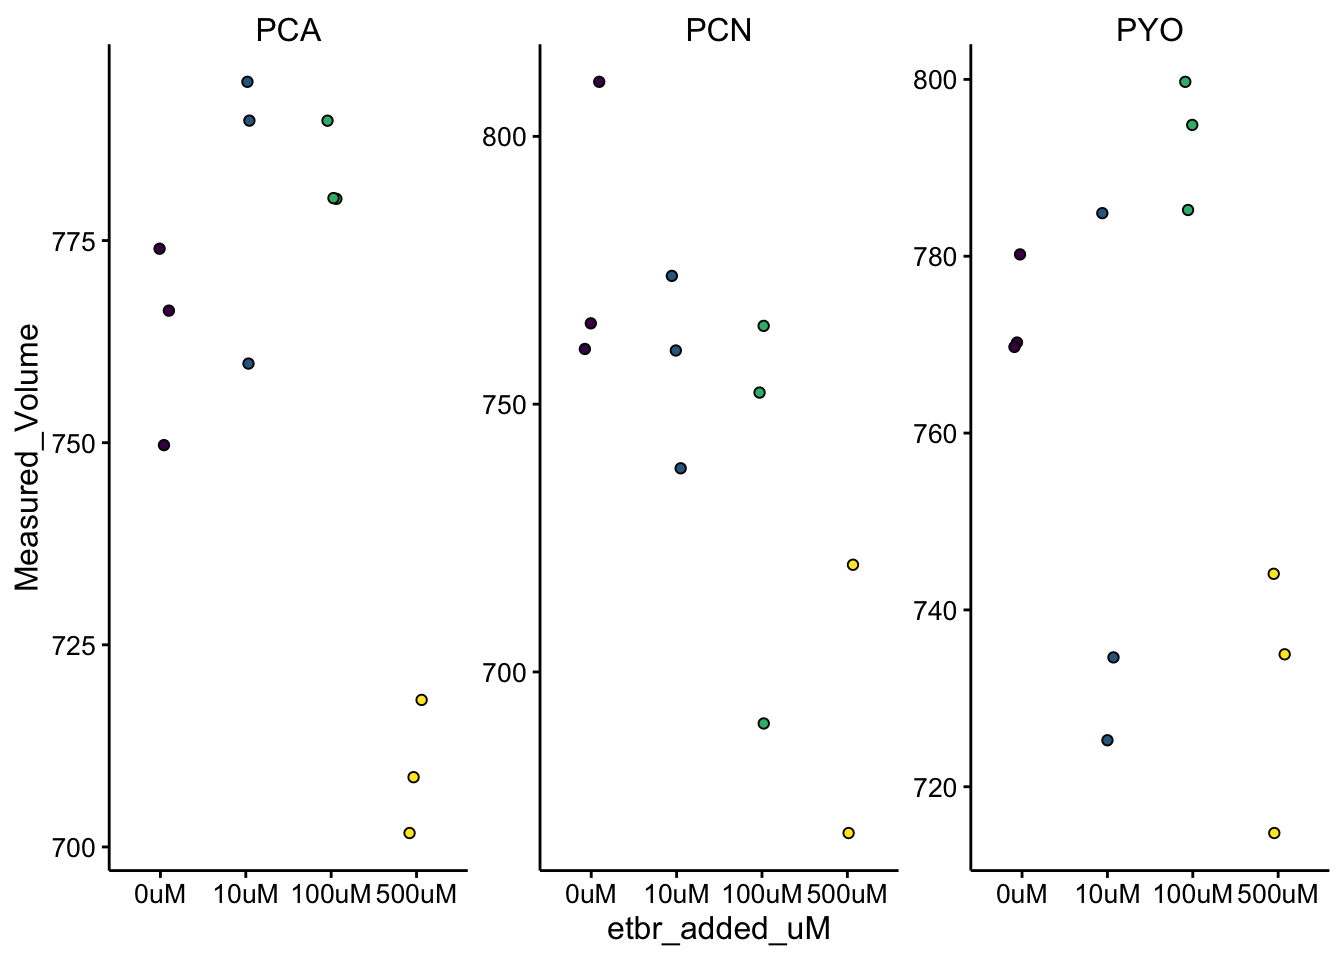
Here we can see a few things.
First, the variation in the measurements between groups is pretty high compared to the DNased colonies. One thing to note is that the DNased colonies were measured with a p200, while these colonies were measured with the p1000 and there may just be an accuracy difference involved in the pipette itself or in the process of filling the tip with liquid (e.g. more bubbles?). The reason I used a different pipette was because the etbr treated colonies were relatively hard to resuspend, so I ended up sort of shearing the biofilm material by pipetting with the p1000 and I was able to suck up larger chunks using the larger tips.
Second, it looks like the 500uM etbr condition had smaller measured volumes for all three of the phenazines, although there’s some variability. This sort of makes sense based on morphology, the etbr colonies all had a compact morphology, but they did seem to be quite thick. However, I think there’s something else going on.
One other reason these colonies may have had consistently smaller volumes, is that they were so hard to get off the membrane that I ended up removing the biofilm / membrane post vortex and transferring to a petri dish. Then I physically removed the biofilm from the membrane using sterilized tweezers. When removing the biofilm and membrane I think a significant amount of liquid was lost. Now the question is - would that skew the LC-MS measurement? Possibly.
If most of the phenazine was already extracted upon vortexing and some of that liquid were lost then the measurement would not be affected. If very little of the phenazine was already extracted and most of it was still in the intact colony, then perhaps the loss of volume would actually skew the concentration slightly higher…I think that both of these effects should be pretty small, but importantly I would say it’s inconclusive whether or not the 500uM etbr colonies actually contained smaller biofilm volumes than the other colonies. As I thought before, I think we don’t really have the resolution to say. These measurements are just not very sensitive…also note that all these volumes are below the initial 800uL, because a significant volume of liquid is lost on all the membranes upon removal (even ones that come out clean). It’s unclear if that loss component is even constant…
Let’s move forward to the LC-MS measurements with this in the back of our minds, but ultimately few conclusions drawn.
DNase
Here’s the DNase treated colonies. I treated both the ∆pelB mutant and the parsek WT strain (background for mutant).
df_dnase <- read_csv("data/2019_10_22_colony_dnase_data.csv")

df_dnase %>% kable() %>% kable_styling() %>% scroll_box(height = "300px")| measured_phenazine | strain | treatment | day | material | rep | RT | Area | Channel Name | Amount |
|---|---|---|---|---|---|---|---|---|---|
| PYO | dPEL | none | D4 | cells | 1 | 6.060 | 68442 | 313.0nm | 2.585 |
| PCA | dPEL | none | D4 | cells | 1 | 2.925 | 10657 | 364.0nm | 0.688 |
| PCN | dPEL | none | D4 | cells | 1 | 8.886 | 226830 | 364.0nm | 17.304 |
| PYO | dPEL | none | D4 | cells | 2 | 6.067 | 70378 | 313.0nm | 2.658 |
| PCA | dPEL | none | D4 | cells | 2 | 2.894 | 9822 | 364.0nm | 0.634 |
| PCN | dPEL | none | D4 | cells | 2 | 8.897 | 215873 | 364.0nm | 16.468 |
| PYO | dPEL | none | D4 | cells | 3 | 6.048 | 73642 | 313.0nm | 2.782 |
| PCA | dPEL | none | D4 | cells | 3 | 2.890 | 9854 | 364.0nm | 0.636 |
| PCN | dPEL | none | D4 | cells | 3 | 8.876 | 219029 | 364.0nm | 16.709 |
| PYO | dPEL | dnase | D4 | cells | 1 | 6.062 | 79850 | 313.0nm | 3.016 |
| PCA | dPEL | dnase | D4 | cells | 1 | 2.890 | 10384 | 364.0nm | 0.670 |
| PCN | dPEL | dnase | D4 | cells | 1 | 8.888 | 235254 | 364.0nm | 17.946 |
| PYO | dPEL | dnase | D4 | cells | 2 | 6.054 | 87142 | 313.0nm | 3.292 |
| PCA | dPEL | dnase | D4 | cells | 2 | 2.887 | 10694 | 364.0nm | 0.690 |
| PCN | dPEL | dnase | D4 | cells | 2 | 8.882 | 238178 | 364.0nm | 18.170 |
| PYO | dPEL | dnase | D4 | cells | 3 | 6.057 | 79659 | 313.0nm | 3.009 |
| PCA | dPEL | dnase | D4 | cells | 3 | 2.892 | 9559 | 364.0nm | 0.617 |
| PCN | dPEL | dnase | D4 | cells | 3 | 8.889 | 224853 | 364.0nm | 17.153 |
| PYO | parWT | none | D4 | cells | 1 | 6.058 | 112620 | 313.0nm | 4.254 |
| PCA | parWT | none | D4 | cells | 1 | 2.884 | 12221 | 364.0nm | 0.788 |
| PCN | parWT | none | D4 | cells | 1 | 8.882 | 221277 | 364.0nm | 16.880 |
| PYO | parWT | none | D4 | cells | 2 | 6.054 | 113343 | 313.0nm | 4.281 |
| PCA | parWT | none | D4 | cells | 2 | 2.890 | 11791 | 364.0nm | 0.761 |
| PCN | parWT | none | D4 | cells | 2 | 8.885 | 235562 | 364.0nm | 17.970 |
| PYO | parWT | none | D4 | cells | 3 | 6.050 | 115030 | 313.0nm | 4.345 |
| PCA | parWT | none | D4 | cells | 3 | 2.899 | 12012 | 364.0nm | 0.775 |
| PCN | parWT | none | D4 | cells | 3 | 8.884 | 220430 | 364.0nm | 16.816 |
| PYO | parWT | dnase | D4 | cells | 1 | 6.035 | 142692 | 313.0nm | 5.390 |
| PCA | parWT | dnase | D4 | cells | 1 | 2.903 | 12500 | 364.0nm | 0.807 |
| PCN | parWT | dnase | D4 | cells | 1 | 8.867 | 265215 | 364.0nm | 20.232 |
| PYO | parWT | dnase | D4 | cells | 2 | 6.033 | 139603 | 313.0nm | 5.273 |
| PCA | parWT | dnase | D4 | cells | 2 | 2.889 | 13201 | 364.0nm | 0.852 |
| PCN | parWT | dnase | D4 | cells | 2 | 8.865 | 261564 | 364.0nm | 19.954 |
| PYO | parWT | dnase | D4 | cells | 3 | 6.050 | 145352 | 313.0nm | 5.491 |
| PCA | parWT | dnase | D4 | cells | 3 | 2.912 | 12819 | 364.0nm | 0.827 |
| PCN | parWT | dnase | D4 | cells | 3 | 8.885 | 257027 | 364.0nm | 19.607 |
| PYO | PBS | blank | blank | blank | 1 | 6.068 | 351 | 313.0nm | 0.013 |
| PCA | PBS | blank | blank | blank | 1 | 2.956 | 228 | 364.0nm | 0.015 |
| PCN | PBS | blank | blank | blank | 1 | 8.879 | 997 | 364.0nm | 0.076 |
| PYO | dPEL | none | D4 | agar | 1 | 6.053 | 8584 | 313.0nm | 0.324 |
| PCA | dPEL | none | D4 | agar | 1 | 2.913 | 31484 | 364.0nm | 2.031 |
| PCN | dPEL | none | D4 | agar | 1 | 8.884 | 85982 | 364.0nm | 6.559 |
| PYO | dPEL | none | D4 | agar | 2 | 6.044 | 8962 | 313.0nm | 0.339 |
| PCA | dPEL | none | D4 | agar | 2 | 2.898 | 30886 | 364.0nm | 1.993 |
| PCN | dPEL | none | D4 | agar | 2 | 8.875 | 78309 | 364.0nm | 5.974 |
| PYO | dPEL | none | D4 | agar | 3 | 6.041 | 9625 | 313.0nm | 0.364 |
| PCA | dPEL | none | D4 | agar | 3 | 2.895 | 29918 | 364.0nm | 1.930 |
| PCN | dPEL | none | D4 | agar | 3 | 8.872 | 65806 | 364.0nm | 5.020 |
| PYO | dPEL | dnase | D4 | agar | 1 | 6.057 | 9722 | 313.0nm | 0.367 |
| PCA | dPEL | dnase | D4 | agar | 1 | 2.892 | 33419 | 364.0nm | 2.156 |
| PCN | dPEL | dnase | D4 | agar | 1 | 8.885 | 76194 | 364.0nm | 5.813 |
| PYO | dPEL | dnase | D4 | agar | 2 | 6.050 | 8473 | 313.0nm | 0.320 |
| PCA | dPEL | dnase | D4 | agar | 2 | 2.897 | 30950 | 364.0nm | 1.997 |
| PCN | dPEL | dnase | D4 | agar | 2 | 8.879 | 80942 | 364.0nm | 6.175 |
| PYO | dPEL | dnase | D4 | agar | 3 | 6.051 | 8515 | 313.0nm | 0.322 |
| PCA | dPEL | dnase | D4 | agar | 3 | 2.906 | 29703 | 364.0nm | 1.916 |
| PCN | dPEL | dnase | D4 | agar | 3 | 8.876 | 84786 | 364.0nm | 6.468 |
| PYO | parWT | none | D4 | agar | 1 | 6.045 | 15368 | 313.0nm | 0.581 |
| PCA | parWT | none | D4 | agar | 1 | 2.903 | 41544 | 364.0nm | 2.680 |
| PCN | parWT | none | D4 | agar | 1 | 8.877 | 78585 | 364.0nm | 5.995 |
| PYO | parWT | none | D4 | agar | 2 | 6.035 | 17317 | 313.0nm | 0.654 |
| PCA | parWT | none | D4 | agar | 2 | 2.894 | 43318 | 364.0nm | 2.795 |
| PCN | parWT | none | D4 | agar | 2 | 8.868 | 91483 | 364.0nm | 6.979 |
| PYO | parWT | none | D4 | agar | 3 | 6.047 | 14197 | 313.0nm | 0.536 |
| PCA | parWT | none | D4 | agar | 3 | 2.878 | 37931 | 364.0nm | 2.447 |
| PCN | parWT | none | D4 | agar | 3 | 8.880 | 77679 | 364.0nm | 5.926 |
| PYO | parWT | dnase | D4 | agar | 1 | 6.040 | 22570 | 313.0nm | 0.853 |
| PCA | parWT | dnase | D4 | agar | 1 | 2.879 | 59650 | 364.0nm | 3.849 |
| PCN | parWT | dnase | D4 | agar | 1 | 8.876 | 78661 | 364.0nm | 6.001 |
| PYO | parWT | dnase | D4 | agar | 2 | 6.048 | 20649 | 313.0nm | 0.780 |
| PCA | parWT | dnase | D4 | agar | 2 | 2.884 | 52045 | 364.0nm | 3.358 |
| PCN | parWT | dnase | D4 | agar | 2 | 8.882 | 67342 | 364.0nm | 5.137 |
| PYO | parWT | dnase | D4 | agar | 3 | 6.051 | 19935 | 313.0nm | 0.753 |
| PCA | parWT | dnase | D4 | agar | 3 | 2.883 | 51472 | 364.0nm | 3.321 |
| PCN | parWT | dnase | D4 | agar | 3 | 8.883 | 113146 | 364.0nm | 8.631 |
| PCA | PBS | blank | blank | blank | 1 | 2.926 | 220 | 364.0nm | 0.014 |
| PCN | PBS | blank | blank | blank | 1 | 8.885 | 551 | 364.0nm | 0.042 |
Let’s convert our measurements into biofilm and agar concentrations and also calculate the retention ratios.
# Convert to concentrations

df_dnase_conc <- df_dnase %>% filter(material != "blank") %>%
    mutate(phz_conc = case_when(material == "cells" ~ Amount *
        2 * 800/60, material == "agar" ~ Amount * 2 * 8/5))

# formatting levels for plotting

# df_dnase_conc$treatment <- factor(df_dnase_conc$treatment,
# levels = c('none','dnase') ) df_dnase_conc$strain <-
# factor(df_dnase_conc$strain, levels = c('parWT','dPEL'))


# Calculate retentions ratios
df_dnase_ratio <- left_join(df_dnase_conc %>% filter(material ==
    "cells"), df_dnase_conc %>% filter(material == "agar"), by = c("measured_phenazine",
    "strain", "treatment", "day", "rep"), suffix = c("_cells",
    "_agar")) %>% mutate(ret_ratio = phz_conc_cells/phz_conc_agar)
Parsek WT
And now let’s compare the treated and untreated WT biofilms:
# ggplot(df_dnase %>% filter(strain == 'parWT'), aes(x =
# treatment, y = Amount, fill = treatment)) +
# geom_jitter(shape = 21, width = 0.1) +
# facet_wrap(material~measured_phenazine, scales = 'free') +
# ylim(0,NA)

ggplot(df_dnase_conc %>% filter(strain == "parWT"), aes(x = treatment,
    y = phz_conc, fill = treatment)) + geom_jitter(shape = 21,
    width = 0.1) + facet_wrap(material ~ measured_phenazine,
    scales = "free") + ylim(0, NA)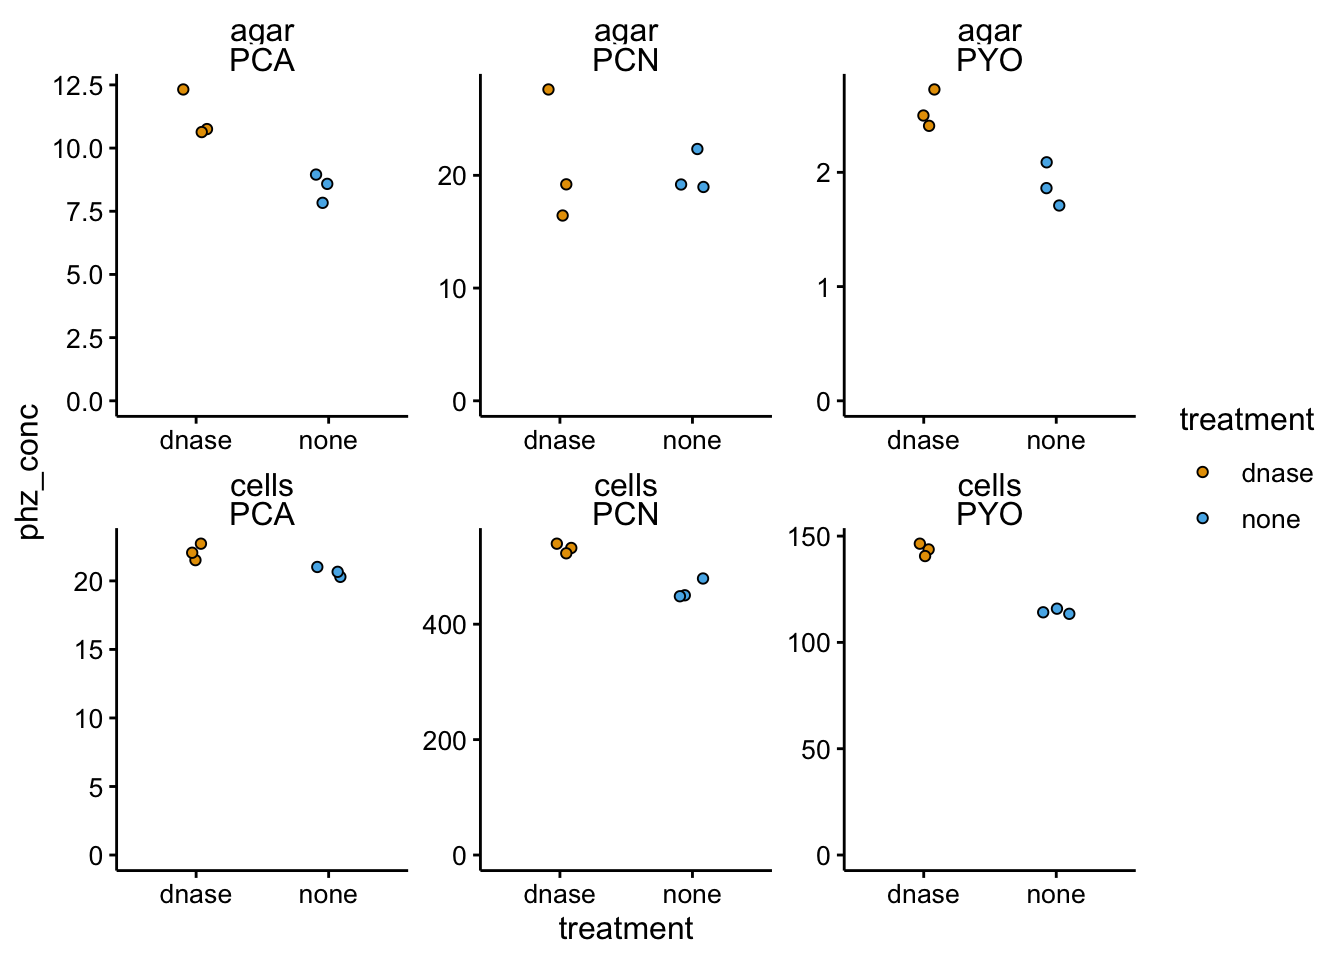
Interesting, looks like there might be some differences, but not in the direction we expected. Let’s look at the data in terms of the retention ratios.
ggplot(df_dnase_ratio %>% filter(strain == "parWT"), aes(x = treatment,
    y = ret_ratio, fill = treatment)) + geom_jitter(shape = 21,
    width = 0.1) + facet_wrap(~measured_phenazine, scales = "free") +
    ylim(0, NA)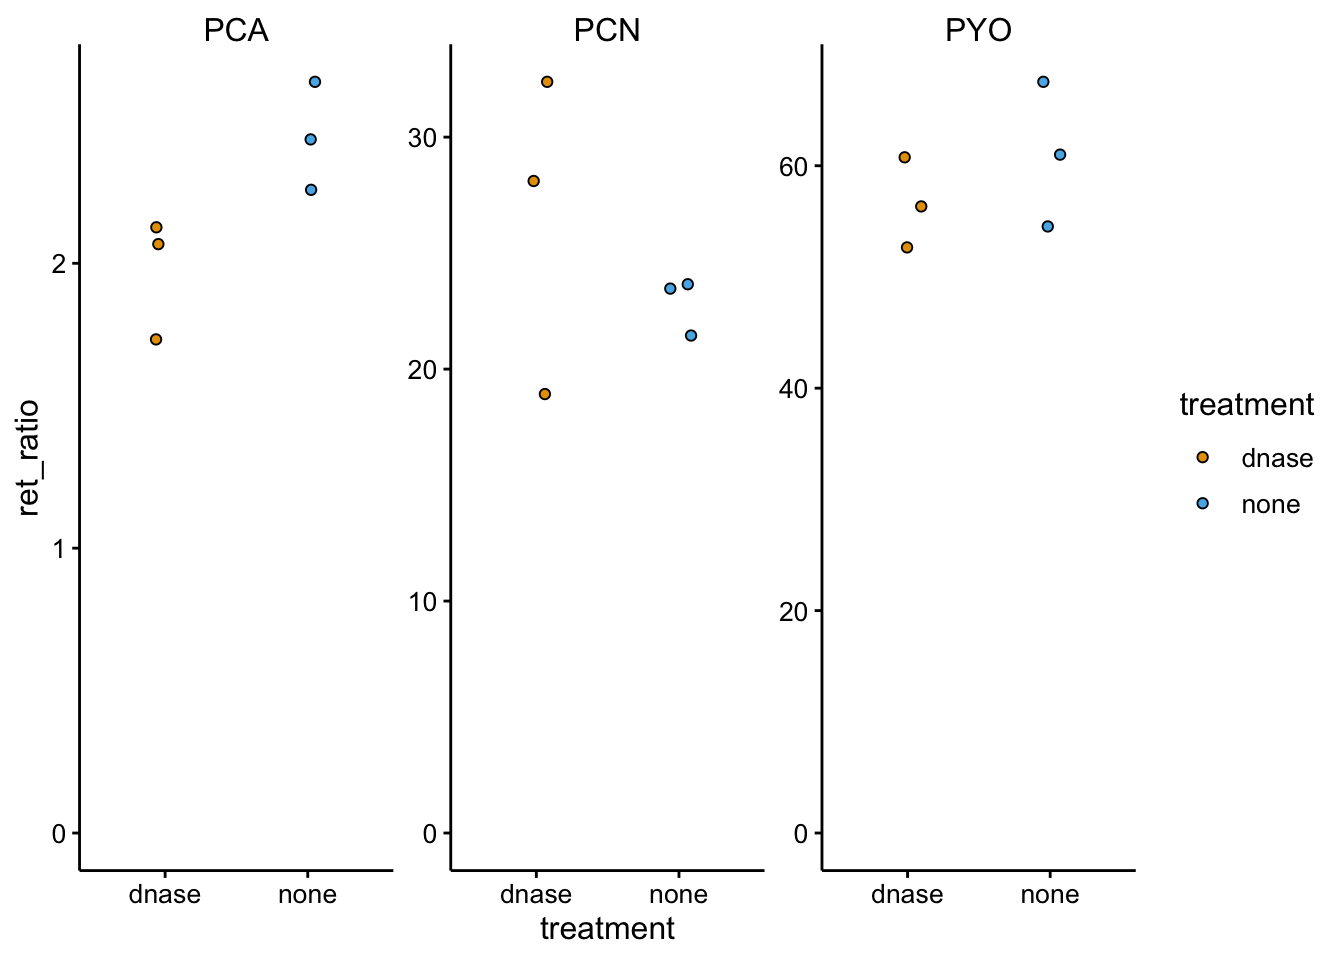
Here the retention ratios all look pretty similar…if anything there was maybe an effect on PCA, which we do not expect with DNase.
∆pelB
Let’s see if the pel mutant looks any different.
ggplot(df_dnase_conc %>% filter(strain == "dPEL"), aes(x = treatment,
    y = phz_conc, fill = treatment)) + geom_jitter(shape = 21,
    width = 0.1) + facet_wrap(material ~ measured_phenazine,
    scales = "free") + ylim(0, NA)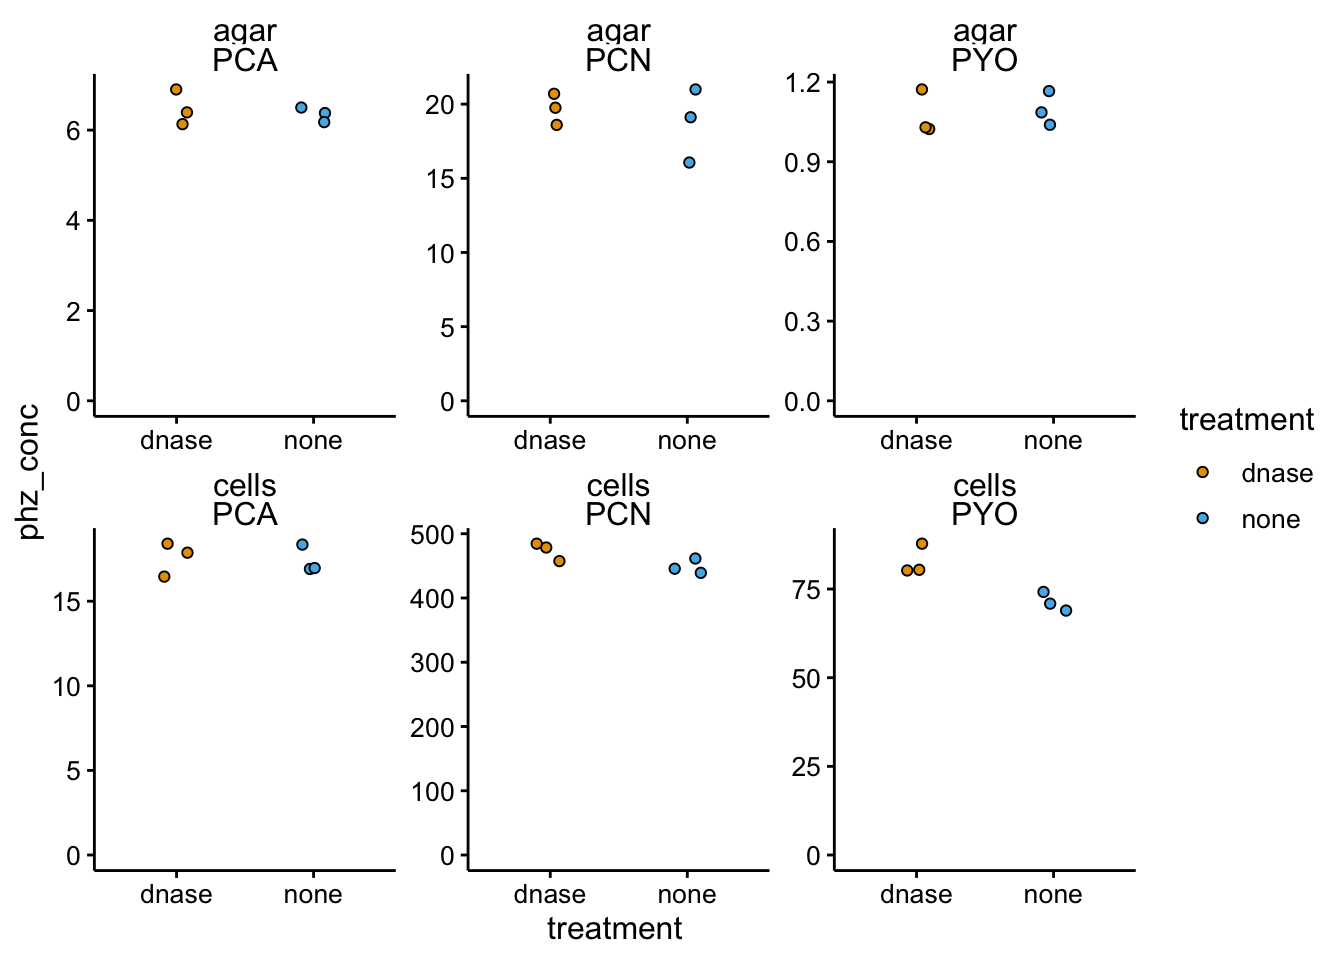
Seems pretty similar to WT. Here’s the retention ratios:
ggplot(df_dnase_ratio %>% filter(strain == "dPEL"), aes(x = treatment,
    y = ret_ratio, fill = treatment)) + geom_jitter(shape = 21,
    width = 0.1) + facet_wrap(~measured_phenazine, scales = "free") +
    ylim(0, NA)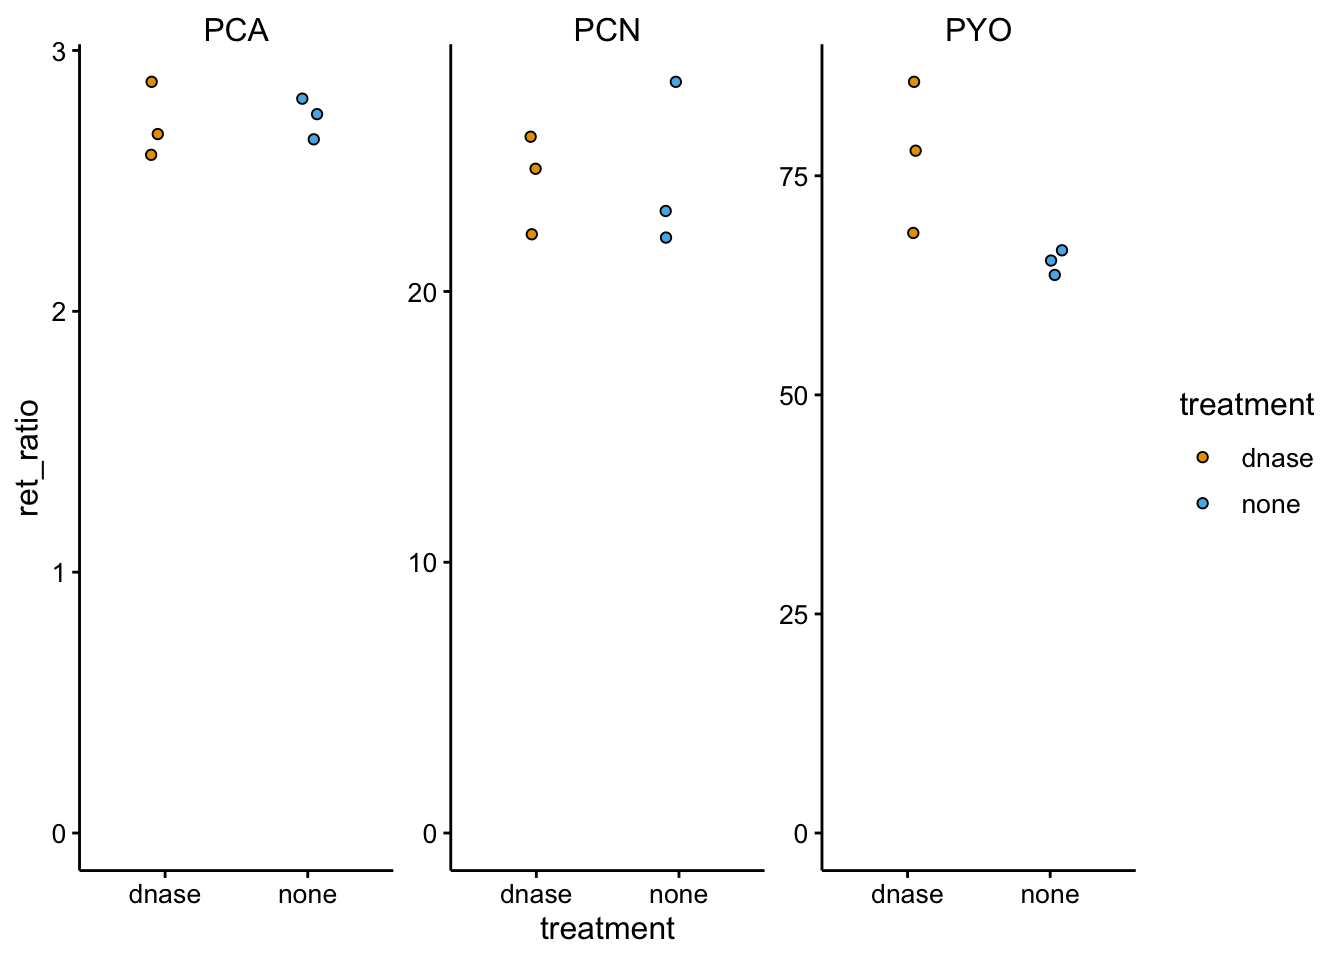
Same story as the WT…basically no differences. If anything more PYO was retained in the treated colony.
This is pretty surprising, but basically the DNase either had no effect or not the same effect as before. I can think of three possible reasons:
- This is a different DNase than used previously. I used a different DNase from sigma previously…I also mixed DNase with exonuclease at various points and maybe I forgot that I also added exo, which mediated the real effect?
- I tried to increase activity with MgSO4…perhaps that had a strong effect that confounded the results.
- There’s some difference in trying to DNase the parsek WT and pel strains compared to the DKNlab WT strain.
I don’t know what the answer is, but it may be worth repeating the DNase experiment exactly as done previously.
WT vs. ∆pel
Do our results conform to the past measurements of these strains?
ggplot(df_dnase_conc %>% filter(treatment == "none"), aes(x = strain,
    y = Amount, fill = treatment)) + geom_jitter(shape = 21,
    width = 0.1) + facet_wrap(material ~ measured_phenazine,
    scales = "free") + ylim(0, NA)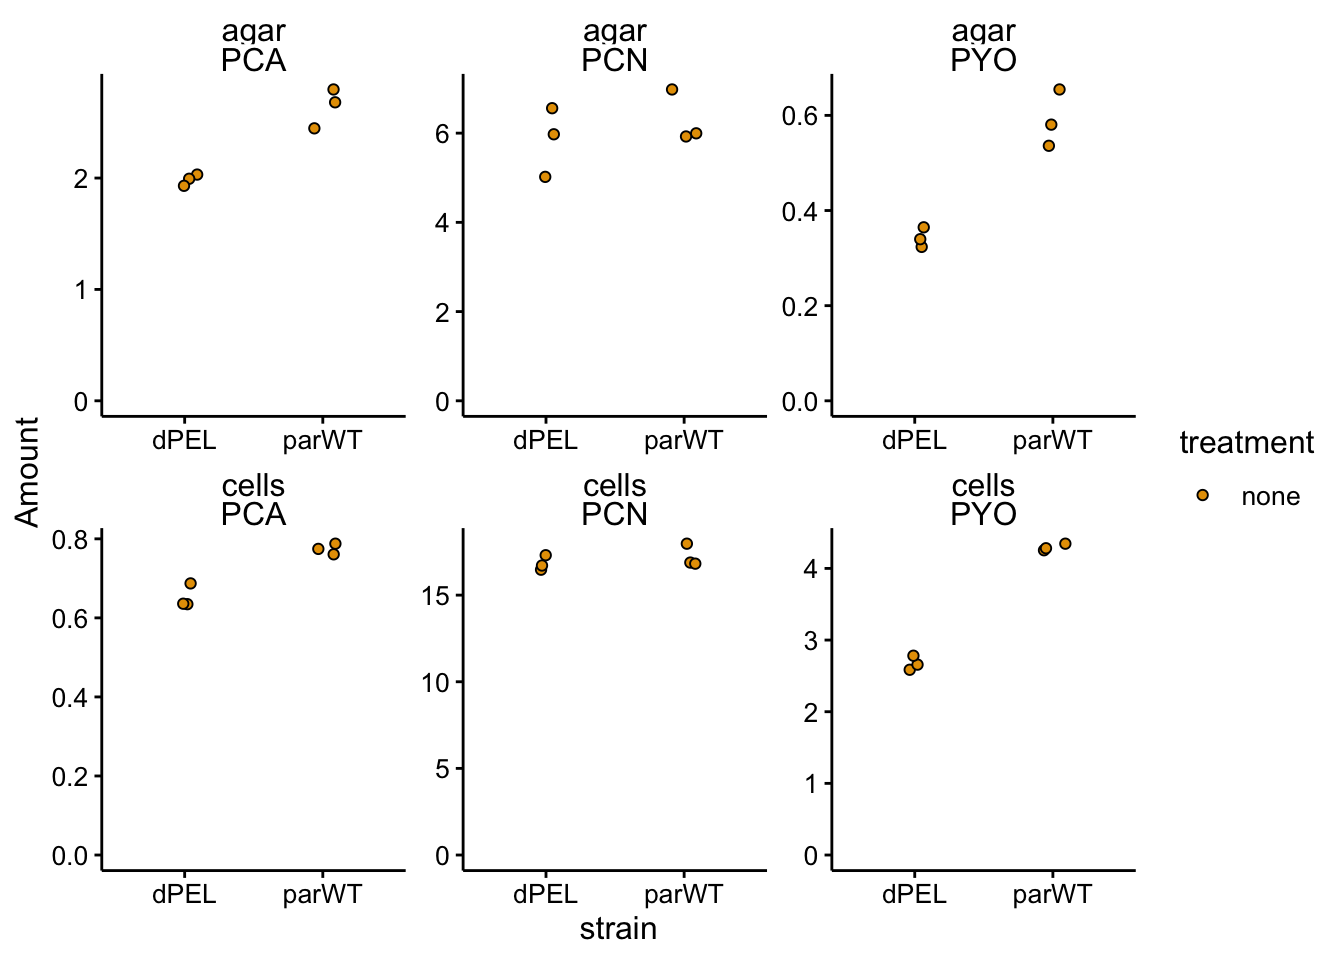
Looks like there are some differences, let’s transform into ratios:
ggplot(df_dnase_ratio %>% filter(treatment == "none"), aes(x = strain,
    y = ret_ratio, fill = treatment)) + geom_jitter(shape = 21,
    width = 0.1) + facet_wrap(~measured_phenazine, scales = "free") +
    ylim(0, NA)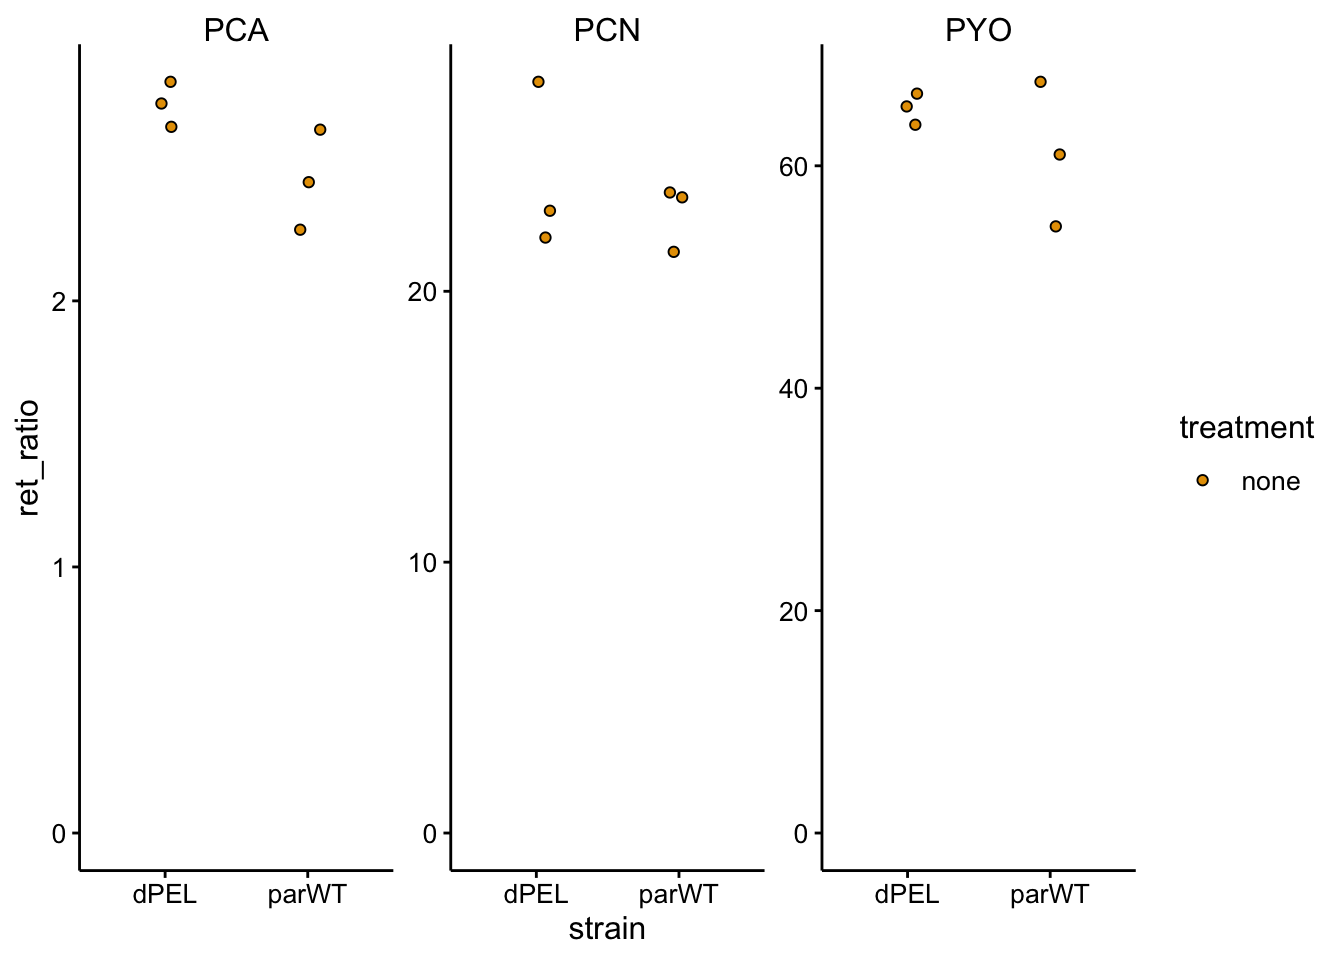
Again, very small differences, not what we saw before when measuring these colonies. It’s unclear if this is normal variation or this is due to the spotting of DNase and the MgSO4? It may be worth repeating these WT vs. ∆pel measurements under normal conditions again.
EtBr
Let’s go ahead and take a look at the ethidium bromide data:
df_etbr <- read_csv("data/2019_10_22_colony_etbr_data.csv")

<<<<<<< HEAD
df_etbr %>% kable() %>% kable_styling() %>% scroll_box(height = "300px")| measured_phenazine | strain | phz_added_uM | phz_added | etbr_added_uM | etbr_added_int | etbr | rep | RT | Area | Channel Name | Amount |
|---|---|---|---|---|---|---|---|---|---|---|---|
| PYO | dPHZstar | 50uM | PYO | 0uM | 0 | etbr | 1 | 6.038 | 348084 | 313.0nm | 13.149 |
| PCA | dPHZstar | 50uM | PYO | 0uM | 0 | etbr | 1 | 2.846 | 31 | 364.0nm | 0.002 |
| PCN | dPHZstar | 50uM | PYO | 0uM | 0 | etbr | 1 | 8.706 | 517 | 364.0nm | 0.039 |
| PYO | dPHZstar | 50uM | PYO | 0uM | 0 | etbr | 2 | 6.034 | 332025 | 313.0nm | 12.542 |
| PCA | dPHZstar | 50uM | PYO | 0uM | 0 | etbr | 2 | 3.015 | 22 | 364.0nm | 0.001 |
| PCN | dPHZstar | 50uM | PYO | 0uM | 0 | etbr | 2 | 8.694 | 614 | 364.0nm | 0.047 |
| PYO | dPHZstar | 50uM | PYO | 0uM | 0 | etbr | 3 | 6.039 | 382146 | 313.0nm | 14.435 |
| PCA | dPHZstar | 50uM | PYO | 0uM | 0 | etbr | 3 | 2.974 | 39 | 364.0nm | 0.003 |
| PCN | dPHZstar | 50uM | PYO | 0uM | 0 | etbr | 3 | 8.701 | 436 | 364.0nm | 0.033 |
| PYO | dPHZstar | 50uM | PYO | 10uM | 10 | etbr | 1 | 6.042 | 450658 | 313.0nm | 17.023 |
| PCA | dPHZstar | 50uM | PYO | 10uM | 10 | etbr | 1 | 3.088 | 32 | 364.0nm | 0.002 |
| PCN | dPHZstar | 50uM | PYO | 10uM | 10 | etbr | 1 | 8.776 | 319 | 364.0nm | 0.024 |
| PYO | dPHZstar | 50uM | PYO | 10uM | 10 | etbr | 2 | 6.045 | 371913 | 313.0nm | 14.049 |
| PCA | dPHZstar | 50uM | PYO | 10uM | 10 | etbr | 2 | 3.118 | 20 | 364.0nm | 0.001 |
| PCN | dPHZstar | 50uM | PYO | 10uM | 10 | etbr | 2 | 8.705 | 309 | 364.0nm | 0.024 |
| PYO | dPHZstar | 50uM | PYO | 10uM | 10 | etbr | 3 | 6.048 | 452176 | 313.0nm | 17.081 |
| PCA | dPHZstar | 50uM | PYO | 10uM | 10 | etbr | 3 | 2.947 | 77 | 364.0nm | 0.005 |
| PCN | dPHZstar | 50uM | PYO | 10uM | 10 | etbr | 3 | 8.792 | 361 | 364.0nm | 0.028 |
| PYO | dPHZstar | 50uM | PYO | 100uM | 100 | etbr | 1 | 6.046 | 356788 | 313.0nm | 13.477 |
| PCA | dPHZstar | 50uM | PYO | 100uM | 100 | etbr | 1 | 3.100 | 48 | 364.0nm | 0.003 |
| PCN | dPHZstar | 50uM | PYO | 100uM | 100 | etbr | 1 | 8.793 | 493 | 364.0nm | 0.038 |
| PYO | dPHZstar | 50uM | PYO | 100uM | 100 | etbr | 2 | 6.024 | 209776 | 313.0nm | 7.924 |
| PCA | dPHZstar | 50uM | PYO | 100uM | 100 | etbr | 2 | 3.079 | 55 | 364.0nm | 0.004 |
| PCN | dPHZstar | 50uM | PYO | 100uM | 100 | etbr | 2 | 8.781 | 610 | 364.0nm | 0.047 |
| PYO | dPHZstar | 50uM | PYO | 100uM | 100 | etbr | 3 | 6.054 | 376108 | 313.0nm | 14.207 |
| PCA | dPHZstar | 50uM | PYO | 100uM | 100 | etbr | 3 | 2.715 | 54 | 364.0nm | 0.003 |
| PCN | dPHZstar | 50uM | PYO | 100uM | 100 | etbr | 3 | 8.802 | 582 | 364.0nm | 0.044 |
| PYO | dPHZstar | 50uM | PYO | 500uM | 500 | etbr | 1 | 6.048 | 243798 | 313.0nm | 9.209 |
| PCA | dPHZstar | 50uM | PYO | 500uM | 500 | etbr | 1 | 2.780 | 79 | 364.0nm | 0.005 |
| PCN | dPHZstar | 50uM | PYO | 500uM | 500 | etbr | 1 | 8.802 | 1009 | 364.0nm | 0.077 |
| PYO | dPHZstar | 50uM | PYO | 500uM | 500 | etbr | 2 | 6.057 | 243376 | 313.0nm | 9.193 |
| PCA | dPHZstar | 50uM | PYO | 500uM | 500 | etbr | 2 | 2.914 | 83 | 364.0nm | 0.005 |
| PCN | dPHZstar | 50uM | PYO | 500uM | 500 | etbr | 2 | 8.812 | 590 | 364.0nm | 0.045 |
| PYO | dPHZstar | 50uM | PYO | 500uM | 500 | etbr | 3 | 6.035 | 260997 | 313.0nm | 9.859 |
| PCA | dPHZstar | 50uM | PYO | 500uM | 500 | etbr | 3 | 2.654 | 34 | 364.0nm | 0.002 |
| PCN | dPHZstar | 50uM | PYO | 500uM | 500 | etbr | 3 | 8.795 | 1608 | 364.0nm | 0.123 |
| PYO | PBS | blank | blank | blank | NA | blank | 1 | 6.037 | 353 | 313.0nm | 0.013 |
| PCA | PBS | blank | blank | blank | NA | blank | 1 | 2.942 | 218 | 364.0nm | 0.014 |
| PCN | PBS | blank | blank | blank | NA | blank | 1 | 8.792 | 808 | 364.0nm | 0.062 |
| PYO | dPHZstar | 50uM | PCN | 0uM | 0 | etbr | 1 | 6.045 | 45 | 313.0nm | 0.002 |
| PCA | dPHZstar | 50uM | PCN | 0uM | 0 | etbr | 1 | 3.085 | 45 | 364.0nm | 0.003 |
| PCN | dPHZstar | 50uM | PCN | 0uM | 0 | etbr | 1 | 8.869 | 33920 | 364.0nm | 2.588 |
| PCA | dPHZstar | 50uM | PCN | 0uM | 0 | etbr | 2 | 3.091 | 40 | 364.0nm | 0.003 |
| PCN | dPHZstar | 50uM | PCN | 0uM | 0 | etbr | 2 | 8.872 | 34694 | 364.0nm | 2.647 |
| PCA | dPHZstar | 50uM | PCN | 0uM | 0 | etbr | 3 | 3.141 | 46 | 364.0nm | 0.003 |
| PCN | dPHZstar | 50uM | PCN | 0uM | 0 | etbr | 3 | 8.862 | 36553 | 364.0nm | 2.788 |
| PCA | dPHZstar | 50uM | PCN | 10uM | 10 | etbr | 1 | 2.784 | 34 | 364.0nm | 0.002 |
| PCN | dPHZstar | 50uM | PCN | 10uM | 10 | etbr | 1 | 8.867 | 32268 | 364.0nm | 2.462 |
| PCA | dPHZstar | 50uM | PCN | 10uM | 10 | etbr | 2 | 2.654 | 28 | 364.0nm | 0.002 |
| PCN | dPHZstar | 50uM | PCN | 10uM | 10 | etbr | 2 | 8.872 | 33605 | 364.0nm | 2.564 |
| PCA | dPHZstar | 50uM | PCN | 10uM | 10 | etbr | 3 | 2.663 | 49 | 364.0nm | 0.003 |
| PCN | dPHZstar | 50uM | PCN | 10uM | 10 | etbr | 3 | 8.869 | 33102 | 364.0nm | 2.525 |
| PYO | dPHZstar | 50uM | PCN | 100uM | 100 | etbr | 1 | 6.010 | 21 | 313.0nm | 0.001 |
| PCA | dPHZstar | 50uM | PCN | 100uM | 100 | etbr | 1 | 2.776 | 48 | 364.0nm | 0.003 |
| PCN | dPHZstar | 50uM | PCN | 100uM | 100 | etbr | 1 | 8.859 | 24916 | 364.0nm | 1.901 |
| PYO | dPHZstar | 50uM | PCN | 100uM | 100 | etbr | 2 | 6.133 | 17 | 313.0nm | 0.001 |
| PCA | dPHZstar | 50uM | PCN | 100uM | 100 | etbr | 2 | 2.795 | 54 | 364.0nm | 0.003 |
| PCN | dPHZstar | 50uM | PCN | 100uM | 100 | etbr | 2 | 8.870 | 27055 | 364.0nm | 2.064 |
| PCA | dPHZstar | 50uM | PCN | 100uM | 100 | etbr | 3 | 2.917 | 39 | 364.0nm | 0.003 |
| PCN | dPHZstar | 50uM | PCN | 100uM | 100 | etbr | 3 | 8.864 | 24836 | 364.0nm | 1.895 |
| PCA | dPHZstar | 50uM | PCN | 500uM | 500 | etbr | 1 | 2.913 | 35 | 364.0nm | 0.002 |
| PCN | dPHZstar | 50uM | PCN | 500uM | 500 | etbr | 1 | 8.874 | 35586 | 364.0nm | 2.715 |
| PYO | dPHZstar | 50uM | PCN | 500uM | 500 | etbr | 2 | 5.973 | 15 | 313.0nm | 0.001 |
| PCA | dPHZstar | 50uM | PCN | 500uM | 500 | etbr | 2 | 2.696 | 42 | 364.0nm | 0.003 |
| PCN | dPHZstar | 50uM | PCN | 500uM | 500 | etbr | 2 | 8.872 | 35579 | 364.0nm | 2.714 |
| PCA | dPHZstar | 50uM | PCN | 500uM | 500 | etbr | 3 | 2.984 | 43 | 364.0nm | 0.003 |
| PCN | dPHZstar | 50uM | PCN | 500uM | 500 | etbr | 3 | 8.870 | 36594 | 364.0nm | 2.792 |
| PYO | PBS | blank | blank | blank | NA | blank | 1 | 6.156 | 147 | 313.0nm | 0.006 |
| PCA | PBS | blank | blank | blank | NA | blank | 1 | 2.701 | 143 | 364.0nm | 0.009 |
| PCN | PBS | blank | blank | blank | NA | blank | 1 | 8.765 | 759 | 364.0nm | 0.058 |
| PYO | dPHZstar | 50uM | PCA | 0uM | 0 | etbr | 1 | 5.986 | 14 | 313.0nm | 0.001 |
| PCA | dPHZstar | 50uM | PCA | 0uM | 0 | etbr | 1 | 2.930 | 7042 | 364.0nm | 0.454 |
| PCN | dPHZstar | 50uM | PCA | 0uM | 0 | etbr | 1 | 8.698 | 996 | 364.0nm | 0.076 |
| PYO | dPHZstar | 50uM | PCA | 0uM | 0 | etbr | 2 | 5.916 | 19 | 313.0nm | 0.001 |
| PCA | dPHZstar | 50uM | PCA | 0uM | 0 | etbr | 2 | 2.902 | 6512 | 364.0nm | 0.420 |
| PCN | dPHZstar | 50uM | PCA | 0uM | 0 | etbr | 2 | 8.707 | 1068 | 364.0nm | 0.081 |
| PCA | dPHZstar | 50uM | PCA | 0uM | 0 | etbr | 3 | 2.907 | 6579 | 364.0nm | 0.424 |
| PCN | dPHZstar | 50uM | PCA | 0uM | 0 | etbr | 3 | 8.697 | 1102 | 364.0nm | 0.084 |
| PCA | dPHZstar | 50uM | PCA | 10uM | 10 | etbr | 1 | 2.915 | 6397 | 364.0nm | 0.413 |
| PCN | dPHZstar | 50uM | PCA | 10uM | 10 | etbr | 1 | 8.690 | 899 | 364.0nm | 0.069 |
| PCA | dPHZstar | 50uM | PCA | 10uM | 10 | etbr | 2 | 2.914 | 6321 | 364.0nm | 0.408 |
| PCN | dPHZstar | 50uM | PCA | 10uM | 10 | etbr | 2 | 8.711 | 980 | 364.0nm | 0.075 |
| PCA | dPHZstar | 50uM | PCA | 10uM | 10 | etbr | 3 | 2.912 | 6623 | 364.0nm | 0.427 |
| PCN | dPHZstar | 50uM | PCA | 10uM | 10 | etbr | 3 | 8.706 | 1076 | 364.0nm | 0.082 |
| PYO | dPHZstar | 50uM | PCA | 100uM | 100 | etbr | 1 | 6.090 | 26 | 313.0nm | 0.001 |
| PCA | dPHZstar | 50uM | PCA | 100uM | 100 | etbr | 1 | 2.909 | 6223 | 364.0nm | 0.402 |
| PCN | dPHZstar | 50uM | PCA | 100uM | 100 | etbr | 1 | 8.896 | 574 | 364.0nm | 0.044 |
| PYO | dPHZstar | 50uM | PCA | 100uM | 100 | etbr | 2 | 6.039 | 16 | 313.0nm | 0.001 |
| PCA | dPHZstar | 50uM | PCA | 100uM | 100 | etbr | 2 | 2.910 | 6658 | 364.0nm | 0.430 |
| PCN | dPHZstar | 50uM | PCA | 100uM | 100 | etbr | 2 | 8.716 | 491 | 364.0nm | 0.037 |
| PCA | dPHZstar | 50uM | PCA | 100uM | 100 | etbr | 3 | 2.911 | 6127 | 364.0nm | 0.395 |
| PCN | dPHZstar | 50uM | PCA | 100uM | 100 | etbr | 3 | 8.911 | 526 | 364.0nm | 0.040 |
| PCA | dPHZstar | 50uM | PCA | 500uM | 500 | etbr | 1 | 2.910 | 8754 | 364.0nm | 0.565 |
| PCN | dPHZstar | 50uM | PCA | 500uM | 500 | etbr | 1 | 8.919 | 616 | 364.0nm | 0.047 |
| PCA | dPHZstar | 50uM | PCA | 500uM | 500 | etbr | 2 | 2.934 | 9064 | 364.0nm | 0.585 |
| PCN | dPHZstar | 50uM | PCA | 500uM | 500 | etbr | 2 | 8.932 | 540 | 364.0nm | 0.041 |
| PCA | dPHZstar | 50uM | PCA | 500uM | 500 | etbr | 3 | 2.939 | 7969 | 364.0nm | 0.514 |
| PCN | dPHZstar | 50uM | PCA | 500uM | 500 | etbr | 3 | 8.930 | 570 | 364.0nm | 0.043 |
| PYO | PBS | blank | blank | blank | NA | blank | 1 | 6.132 | 146 | 313.0nm | 0.006 |
| PCA | PBS | blank | blank | blank | NA | blank | 1 | 3.000 | 79 | 364.0nm | 0.005 |
| PCN | PBS | blank | blank | blank | NA | blank | 1 | 8.781 | 678 | 364.0nm | 0.052 |
Here’s a first plot of the data:
ggplot(df_etbr, aes(x = factor(etbr_added_int), y = Amount, fill = factor(etbr_added_int))) +
    geom_jitter(shape = 21, width = 0.1) + facet_wrap(~phz_added,
    scales = "free") + scale_fill_viridis_d()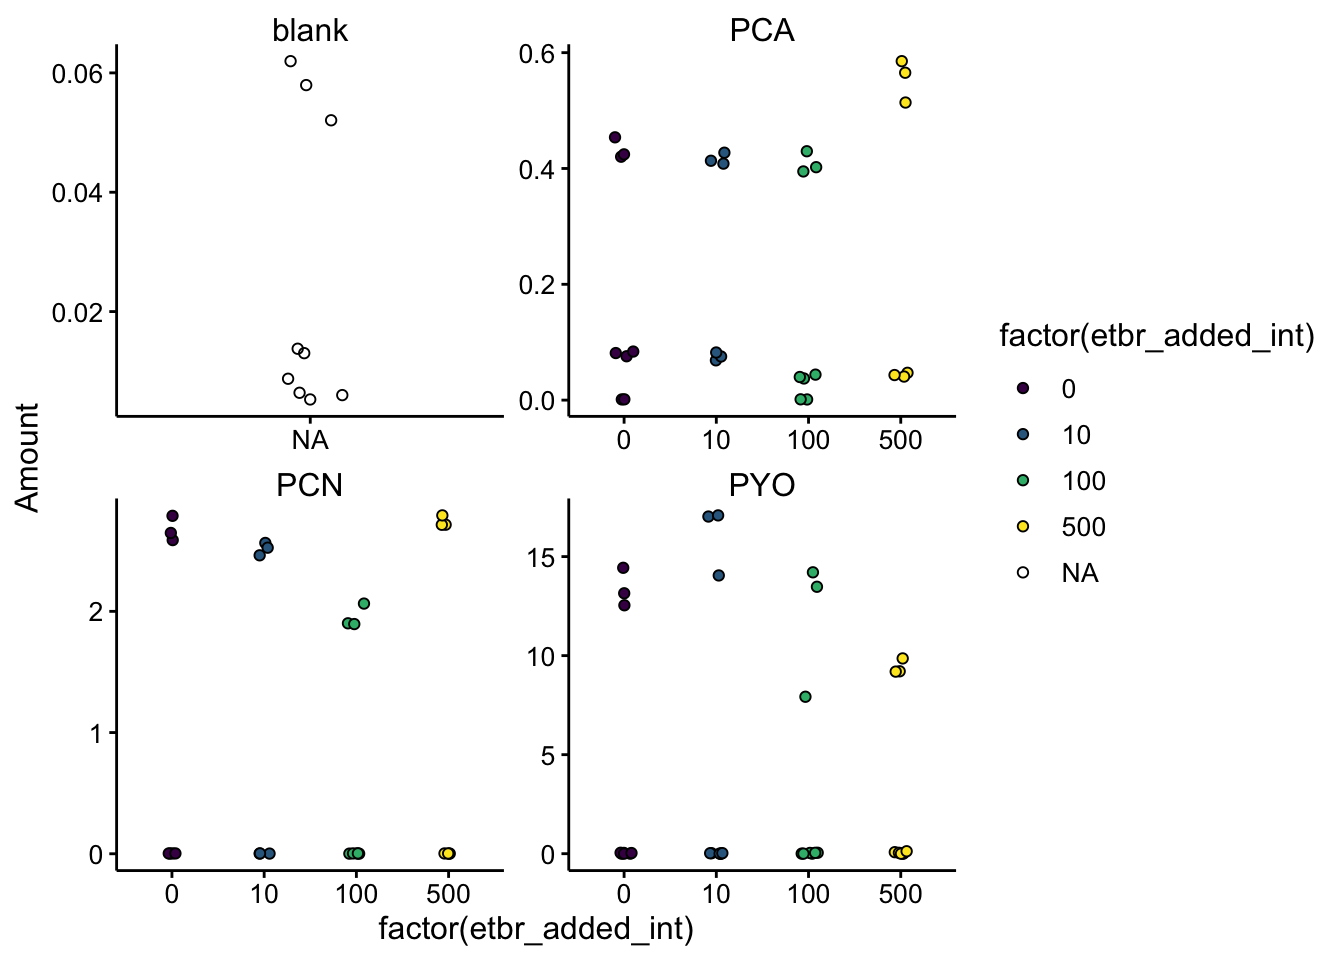
Everything looks pretty good, there are three points detected for each condition, any other time a phenazine was falsely detected its basically at zero. The values for the blanks are also near zero.
Now let’s convert into biofilm concentrations and make our final plot:
======= ggplot(df_etbr, aes(x = factor(etbr_added_int), y = Amount, fill = factor(etbr_added_int))) + geom_jitter(shape = 21, width = 0.1) + facet_wrap(~phz_added, scales = "free") + scale_fill_viridis_d()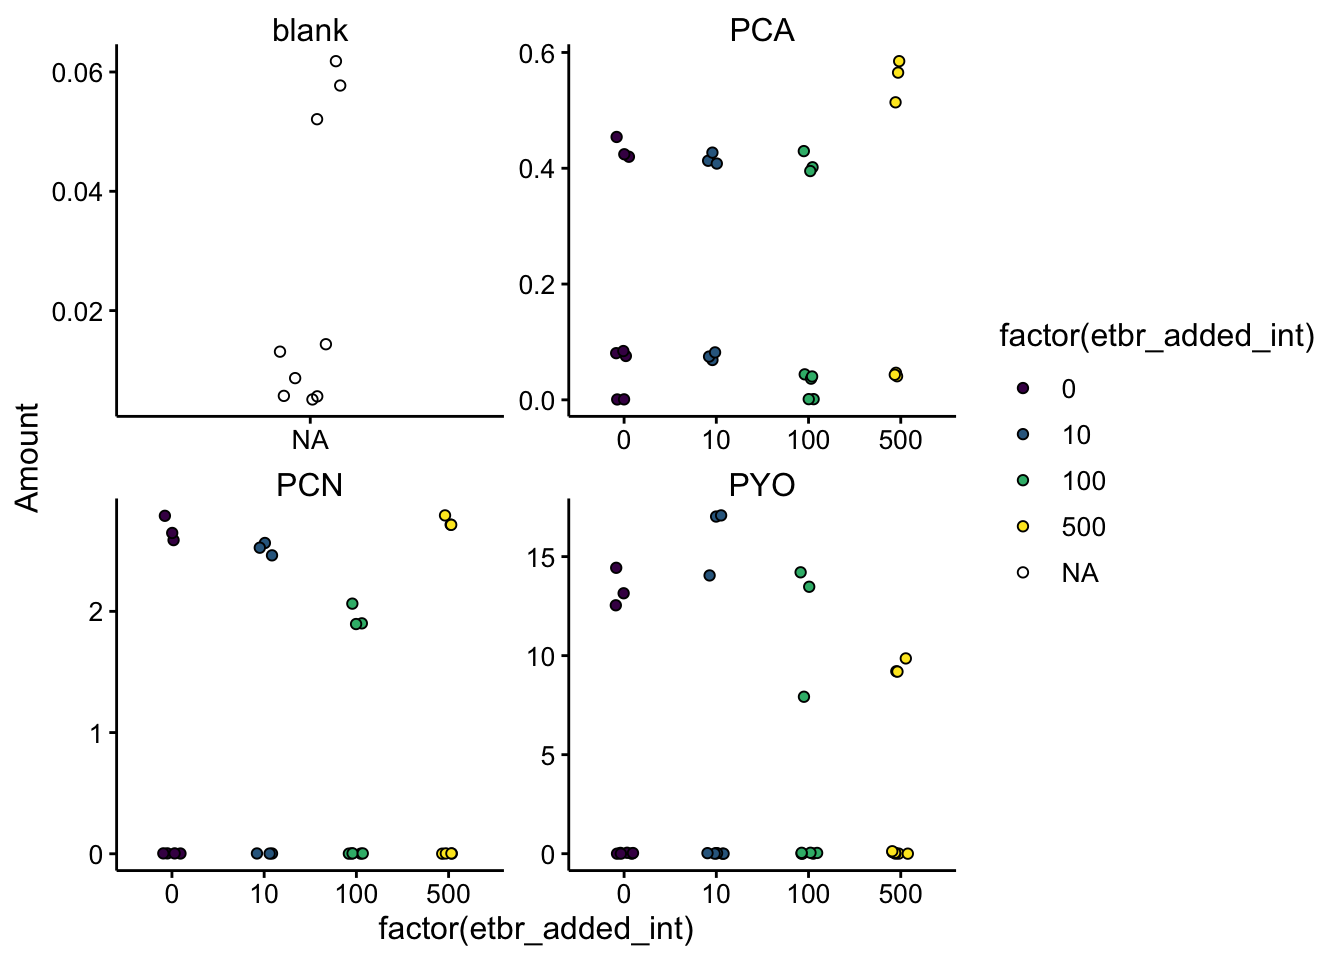
df_etbr_conc <- df_etbr %>% filter(phz_added != "blank") %>%
    filter(measured_phenazine == phz_added) %>% mutate(phz_conc = Amount *
    2 * 800/60) %>% group_by(measured_phenazine, phz_added, etbr_added_uM) %>%
    mutate(mean = mean(phz_conc))

ggplot(df_etbr_conc, aes(x = factor(etbr_added_int), y = phz_conc,
    fill = factor(etbr_added_int))) + geom_col(data = . %>% filter(rep ==
<<<<<<< HEAD
    "1"), aes(y = mean), fill = "light gray") + geom_jitter(shape = 21,
    width = 0.1) + facet_wrap(~phz_added, scales = "free") +
    scale_fill_viridis_d() + ylim(0, NA)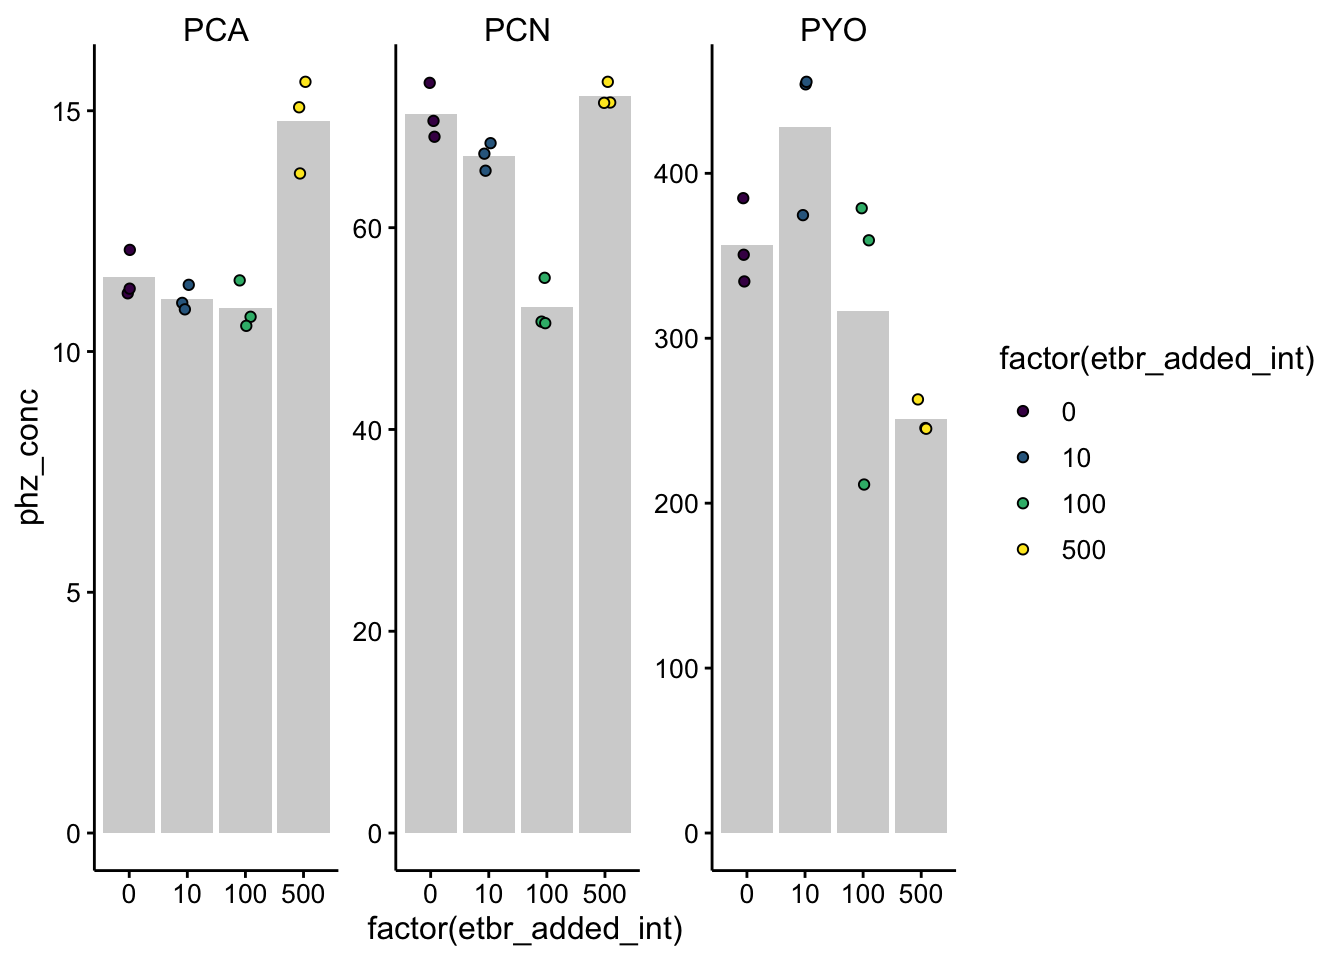
First let’s look at the PCA. The only thing that jumps out is that the 500uM EtBr colony seems to have more PCA than the other conditions. This is not expected, but it may indecate that we are actually biasing that last sample by the way we are extracting, by resuspending the same amount of PCA in a smaller volume. However, a back of the envelope estimate is that the volume changed by ~ 15% and it looks more like a 30% difference here, so I don’t think that explains all of it.
Anyway, it looks like the PCN colonies lose a little PCN as the etbr reaches 100, but then 500 shows no difference. PYO shows a pattern more similar to past data, but it’s still not perfect.
======= 1), aes(y = mean), fill = "light gray") + geom_jitter(shape = 21, width = 0.1) + facet_wrap(~phz_added, scales = "free") + scale_fill_viridis_d() + ylim(0, NA)
Conclusions
Very little about these experimental results conformed to my expectations. It’s unclear whether this was due to changes in experimental setup or true variability in the results. It may be worth repeating these experiments again the way that they were done previously.
Specific to the EtBr experiment, it may also be worth trying etbr concentrations lower than 500 or even 100. It’s not ideal that the colonies have a dramatically different morphology / texture…could suggest the etbr is doing something unintended.
If you repeat the etbr experiment, perhaps try to resuspend the tough etbr colonies using the p1000, while the colony is still on the membrane in the tube. This would prevent any difference in processing involved in taking the colony / membrane out of the tube.
sessionInfo()## R version 3.5.2 (2018-12-20)
## Platform: x86_64-apple-darwin15.6.0 (64-bit)
## Running under: macOS Mojave 10.14.6
##
## Matrix products: default
## BLAS: /Library/Frameworks/R.framework/Versions/3.5/Resources/lib/libRblas.0.dylib
## LAPACK: /Library/Frameworks/R.framework/Versions/3.5/Resources/lib/libRlapack.dylib
##
## locale:
## [1] en_US.UTF-8/en_US.UTF-8/en_US.UTF-8/C/en_US.UTF-8/en_US.UTF-8
##
## attached base packages:
## [1] stats graphics grDevices utils datasets methods base
##
## other attached packages:
## [1] kableExtra_1.0.1 knitr_1.23 viridis_0.5.1
## [4] viridisLite_0.3.0 cowplot_0.9.4 forcats_0.3.0
## [7] stringr_1.3.1 dplyr_0.8.1 purrr_0.2.5
## [10] readr_1.3.1 tidyr_0.8.2 tibble_2.1.3
## [13] ggplot2_3.2.0 tidyverse_1.2.1
##
## loaded via a namespace (and not attached):
## [1] tidyselect_0.2.5 xfun_0.7 haven_2.0.0 lattice_0.20-38
## [5] colorspace_1.4-0 generics_0.0.2 htmltools_0.3.6 yaml_2.2.0
## [9] rlang_0.4.0 pillar_1.3.1 glue_1.3.1 withr_2.1.2
## [13] modelr_0.1.2 readxl_1.2.0 munsell_0.5.0 gtable_0.2.0
## [17] cellranger_1.1.0 rvest_0.3.2 evaluate_0.14 labeling_0.3
## [21] highr_0.7 broom_0.5.1 Rcpp_1.0.1 scales_1.0.0
## [25] backports_1.1.3 formatR_1.5 webshot_0.5.1 jsonlite_1.6
## [29] gridExtra_2.3 hms_0.4.2 digest_0.6.18 stringi_1.2.4
## [33] grid_3.5.2 cli_1.1.0 tools_3.5.2 magrittr_1.5
## [37] lazyeval_0.2.1 crayon_1.3.4 pkgconfig_2.0.2 xml2_1.2.0
## [41] lubridate_1.7.4 assertthat_0.2.1 rmarkdown_1.13 httr_1.4.0
## [45] rstudioapi_0.9.0 R6_2.4.0 nlme_3.1-140 compiler_3.5.2