Agarose PYO 2 Processing
06_07_19
library(tidyverse)
library(cowplot)
library(broom)
library(modelr)
library(viridis)
library(lubridate)
library(hms)

knitr::opts_chunk$set(tidy.opts=list(width.cutoff=60),tidy=TRUE, echo = TRUE, message=FALSE, warning=FALSE, fig.align="center")

source("../../tools/echem_processing_tools.R")
source("../../tools/plotting_tools.R")

theme_set(theme_1())
I was worried about the adsorbed PYO signal from the last run, so I decided to redo the experiment on another IDA. This time I tried the SWV GC measurement scheme during the soak as well as the transfer.
Soak
soak_data_path = "../Data/Soak/"
# divide swv into rep and subrep and then subtract 1 from rep
# to match with GC
SWV_soak_filenames <- dir(path = soak_data_path, pattern = "[swv]+.+[txt]$")
SWV_soak_file_paths <- paste(soak_data_path, SWV_soak_filenames,
sep = "")
swv_soak_data_cols <- c("E", "i1", "i2")
filename_cols = c("echem", "rep")
swv_skip_rows = 18
swv_soak_data <- echem_import_to_df(filenames = SWV_soak_filenames,
file_paths = SWV_soak_file_paths, data_cols = swv_soak_data_cols,
skip_rows = swv_skip_rows, filename_cols = filename_cols,
rep = T, PHZadded = F)
ggplot(swv_soak_data, aes(x = E, y = current, color = rep, group = rep)) +
geom_path() + facet_wrap(~electrode, scales = "free") + scale_color_viridis() +
scale_x_reverse()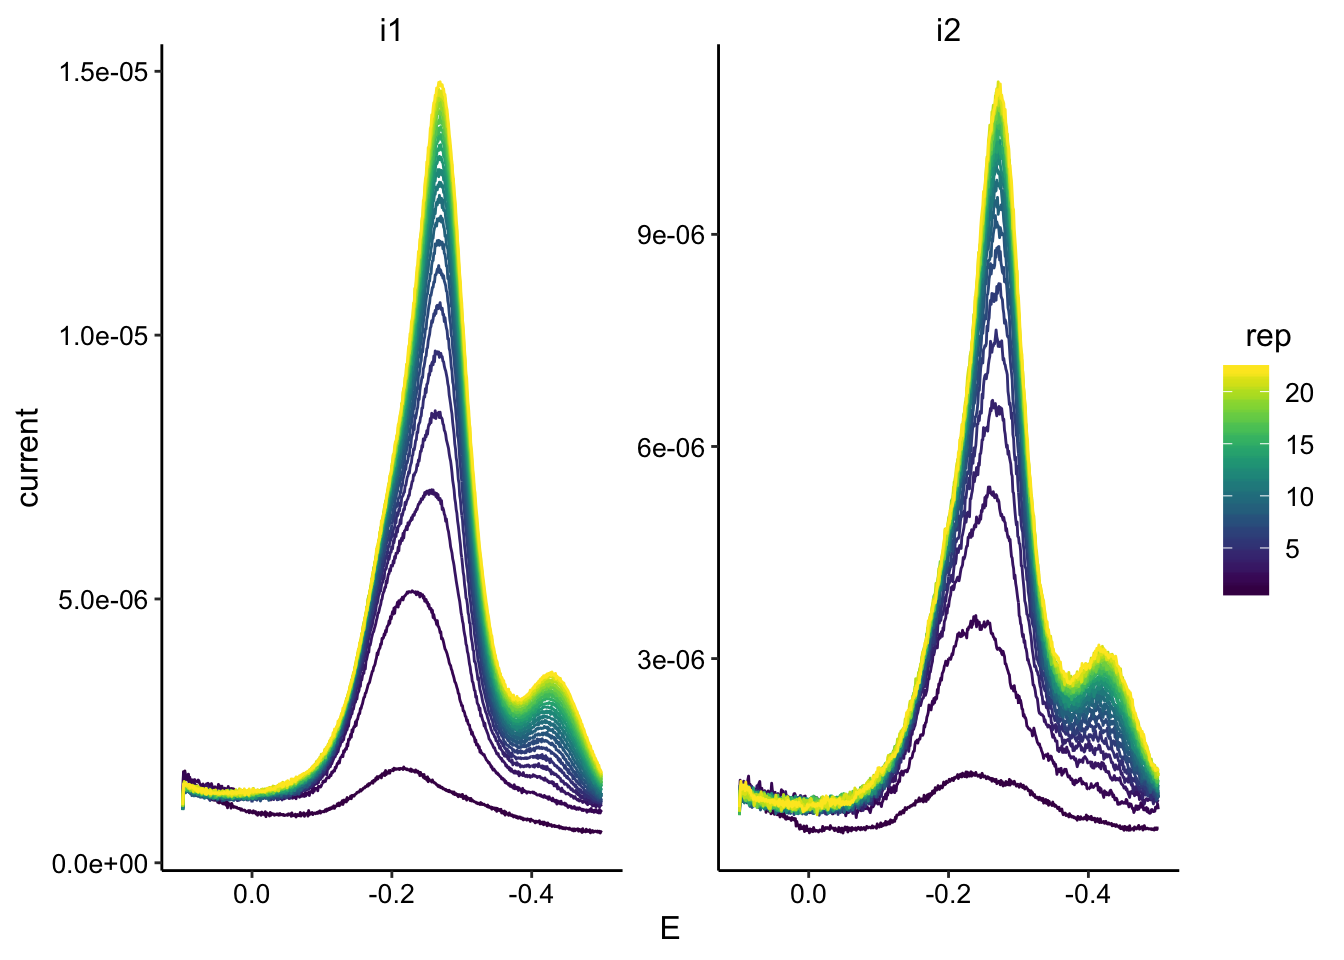 Here you can clearly see a second peak that arises later on around -400mV
swv_soak_max <- swv_soak_data %>% group_by(rep, electrode) %>%
    filter(E < -0.15 & E > -0.35) %>% mutate(max_current = max(abs(current))) %>%
    filter(abs(current) == max_current)


ggplot(swv_soak_max, aes(x = minutes, y = max_current, color = electrode)) +
    geom_point()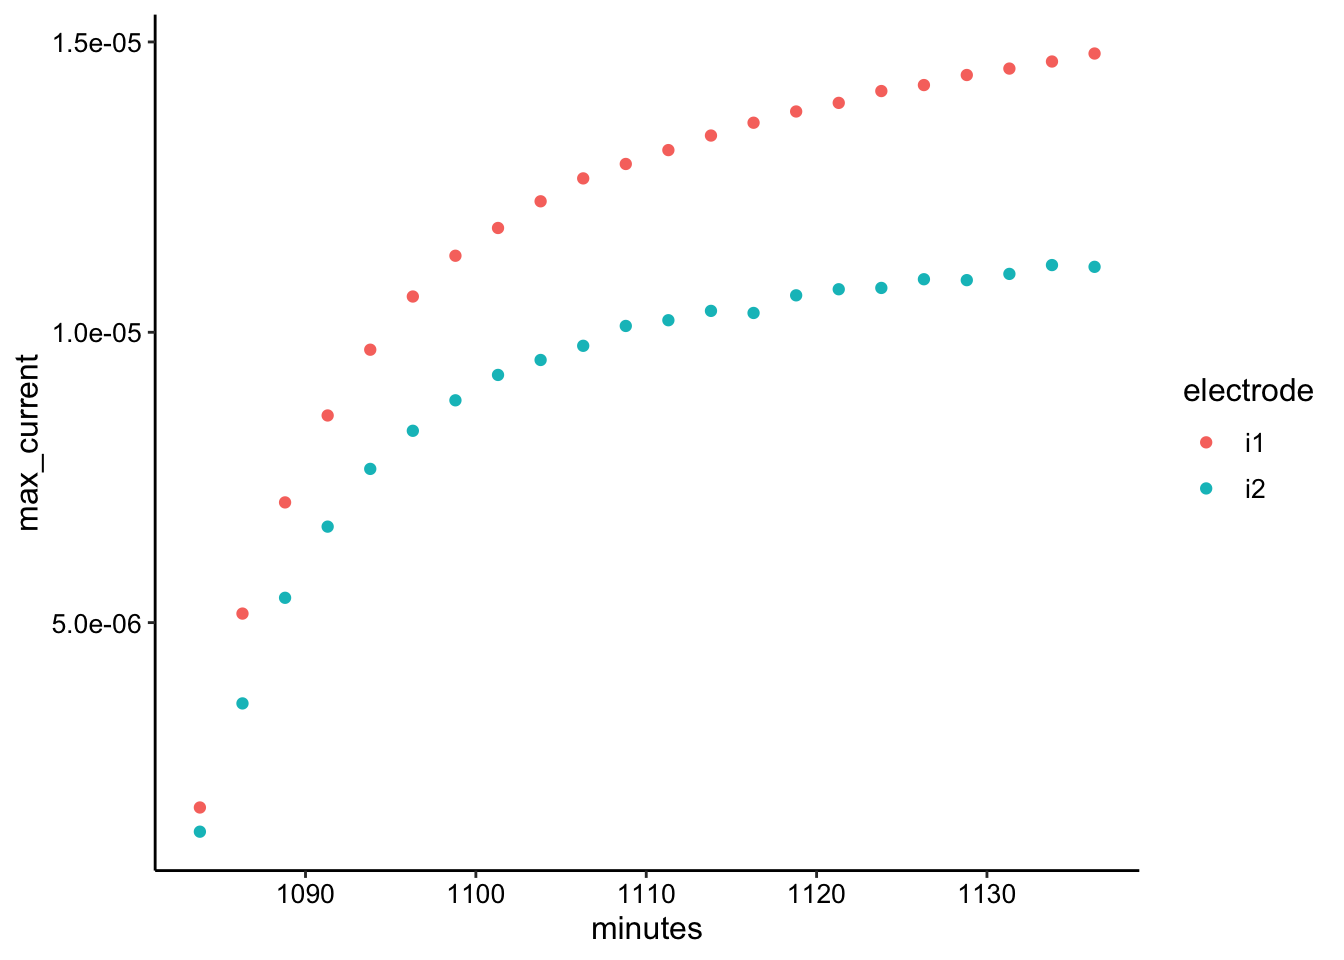
ggplot(swv_soak_data, aes(x = E, y = current, color = rep, group = rep)) +
    geom_path() + geom_point(data = swv_soak_max, aes(x = E,
    y = max_current), color = "red", size = 2) + facet_wrap(~electrode,
    scales = "free") + scale_color_viridis() + scale_x_reverse()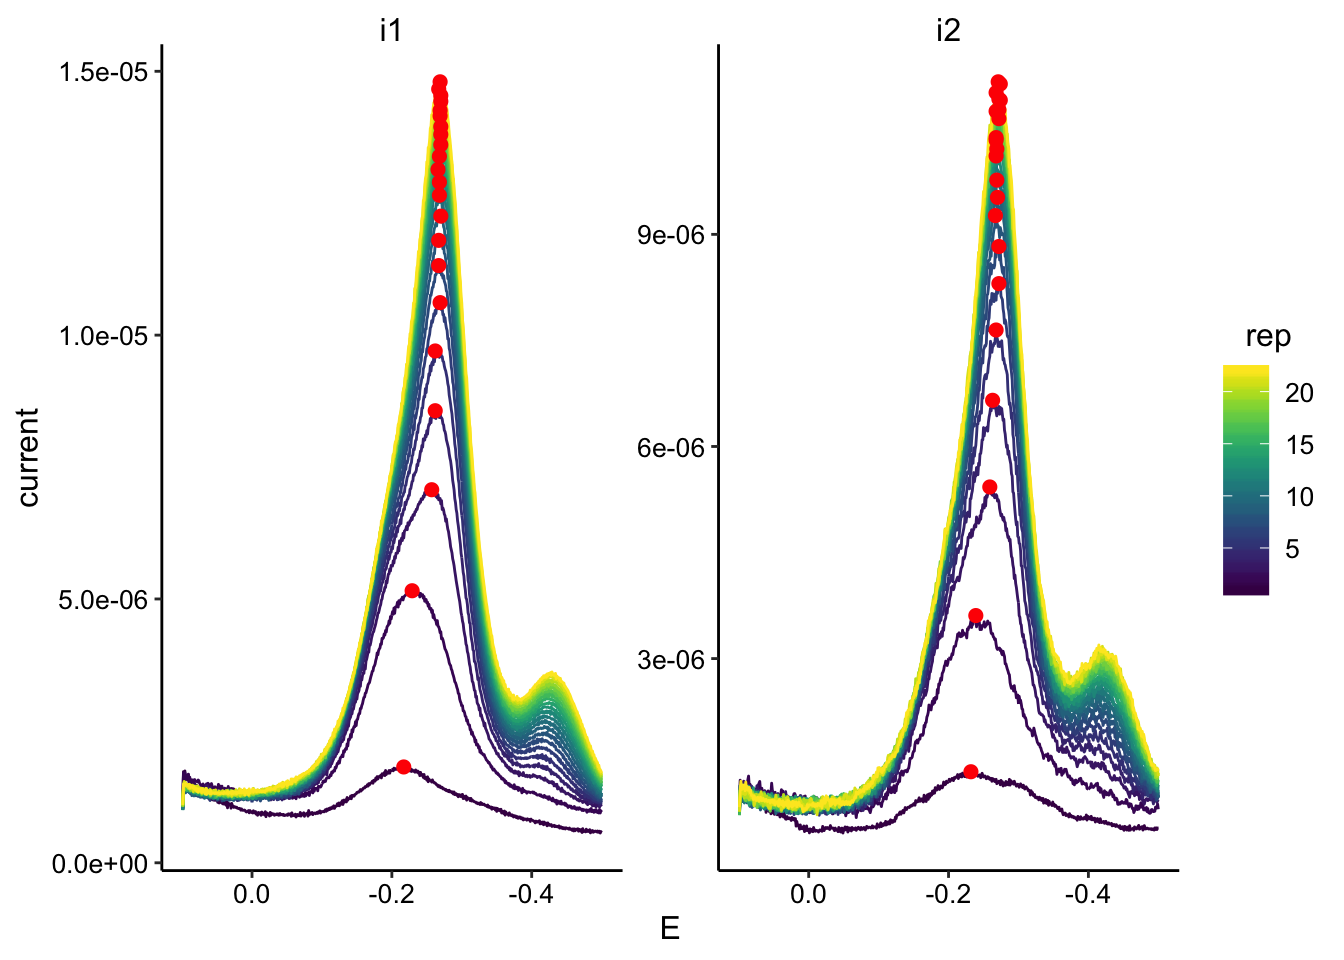
soak_data_path = "../Data/Soak/"
# divide swv into rep and subrep and then subtract 1 from rep
# to match with GC
GC_soak_filenames <- dir(path = soak_data_path, pattern = "[gc]+.+[txt]$")

GC_soak_file_paths <- paste(soak_data_path, GC_soak_filenames,
    sep = "")

gc_soak_data_cols <- c("E", "i1", "i2")

filename_cols = c("echem", "rep")

gc_skip_rows = 21


gc_soak_data <- echem_import_to_df(filenames = GC_soak_filenames,
    file_paths = GC_soak_file_paths, data_cols = gc_soak_data_cols,
    skip_rows = gc_skip_rows, filename_cols = filename_cols,
    rep = T, PHZadded = F)

ggplot(gc_soak_data, aes(x = E, y = current, color = rep, group = rep)) +
    geom_path() + scale_color_viridis() + scale_x_reverse()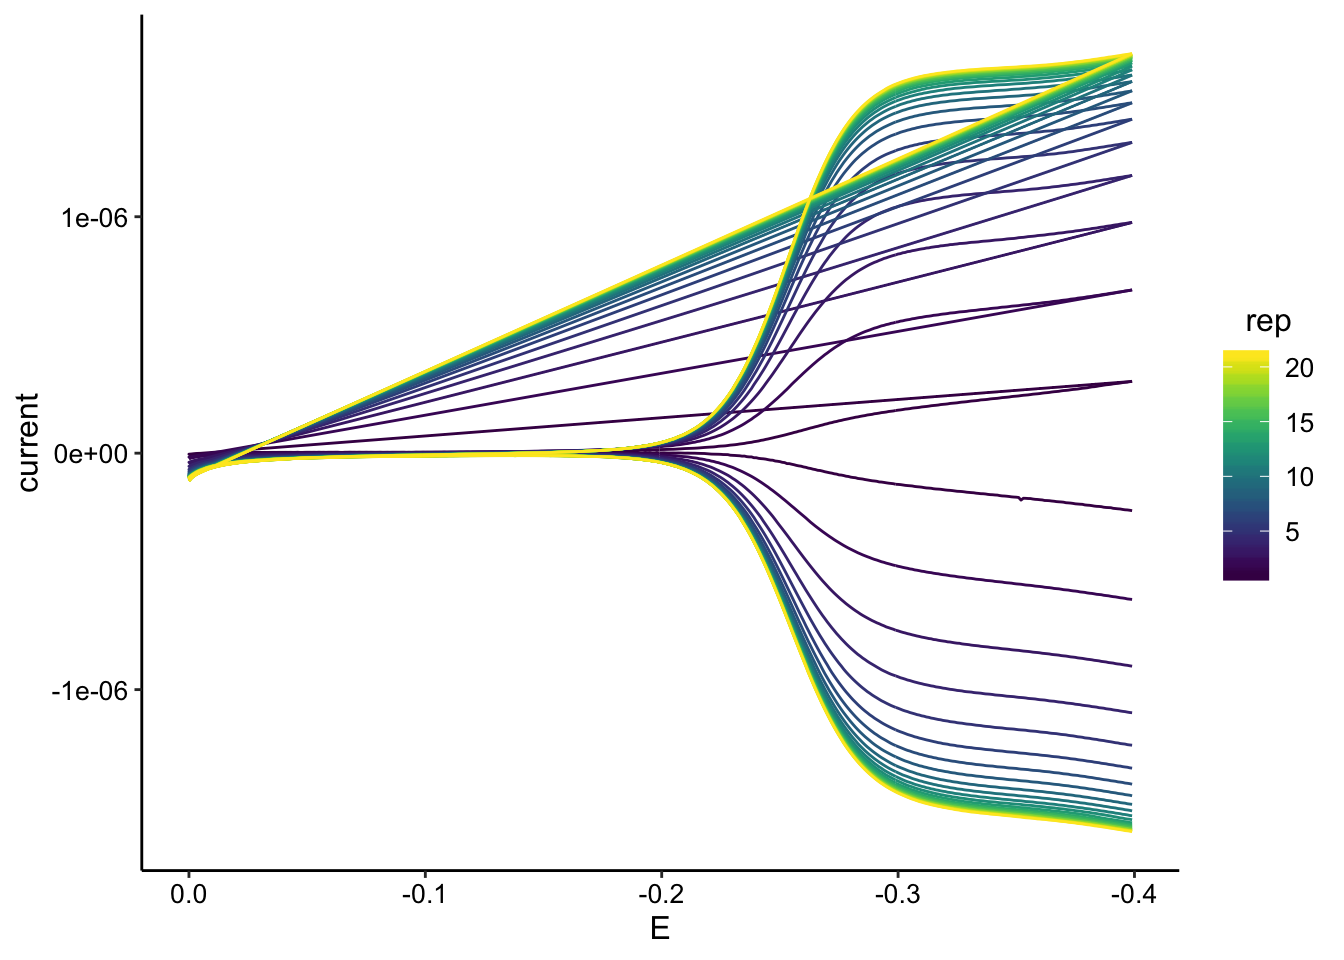
gc_soak_max <- gc_soak_data %>% group_by(rep, electrode) %>%
    filter(E < -0.2) %>% mutate(max_current = max(abs(current))) %>%
    filter(abs(current) == max_current)


ggplot(gc_soak_max, aes(x = minutes, y = max_current, color = electrode)) +
    geom_point()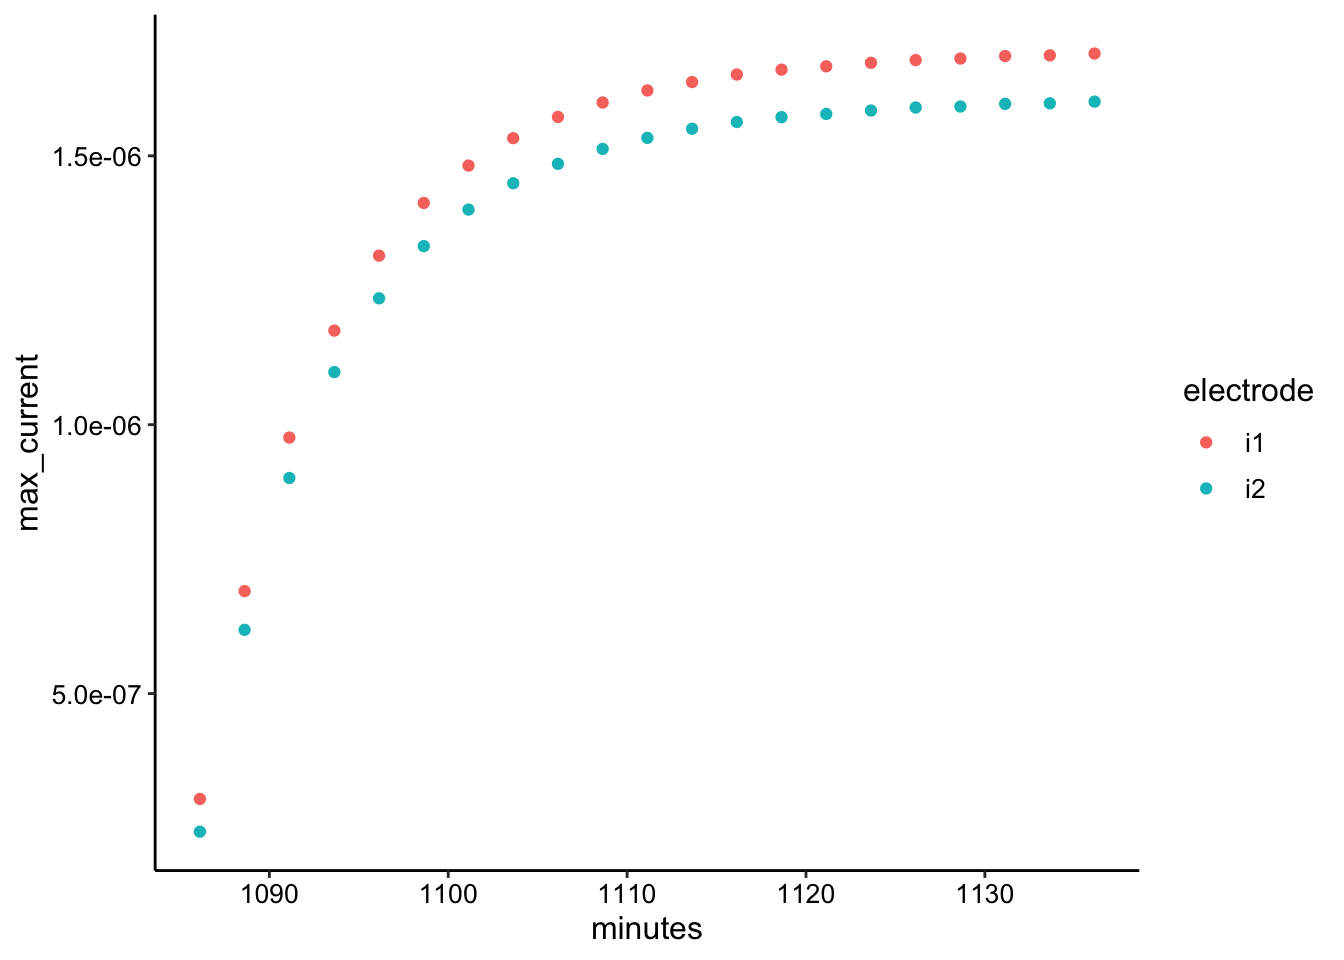
ggplot(gc_soak_data, aes(x = E, y = abs(current), color = rep,
    group = rep)) + geom_path() + geom_point(data = gc_soak_max,
    aes(x = E, y = max_current), color = "red", size = 2) + facet_wrap(~electrode) +
    scale_color_viridis() + scale_x_reverse()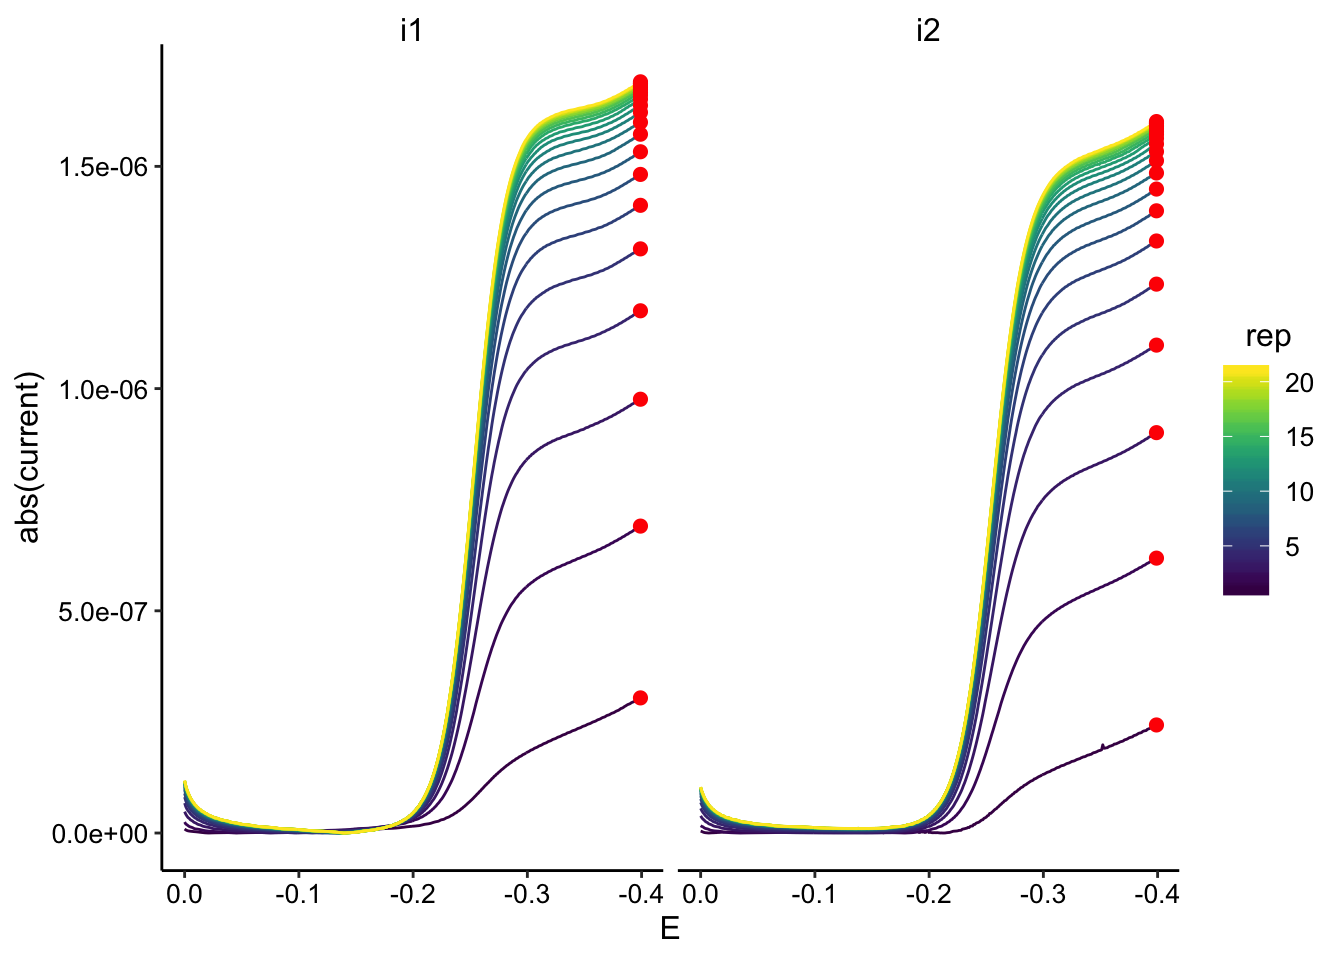
soak_max_comb_i1 <- left_join(swv_soak_max %>% ungroup() %>%
    filter(electrode == "i1") %>% mutate(rep = rep - 1), gc_soak_max %>%
    filter(electrode == "i2"), by = c("rep"), suffix = c("_swv",
    "_gc"))

soak_max_comb_i2 <- left_join(swv_soak_max %>% ungroup() %>%
    filter(electrode == "i2") %>% mutate(rep = rep - 1), gc_soak_max %>%
    filter(electrode == "i2"), by = c("rep"), suffix = c("_swv",
    "_gc"))

# %>% mutate(norm_time = minutes_swv - min(minutes_swv))

ggplot(soak_max_comb_i1, aes(x = max_current_swv, y = max_current_gc)) +
    geom_point() + geom_smooth(data = soak_max_comb_i1 %>% filter(rep <
    10), method = "lm")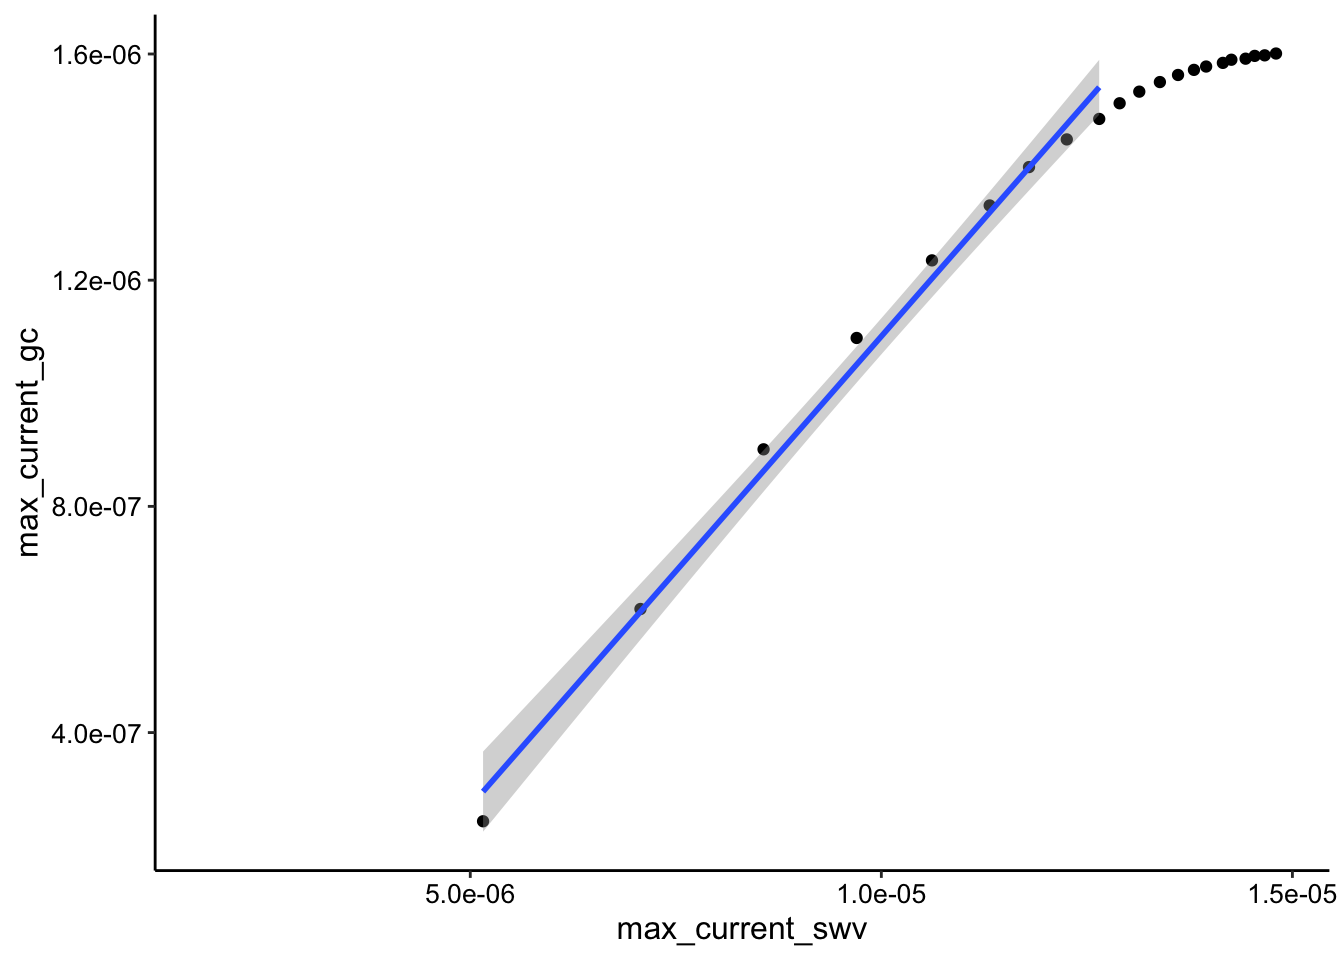
ggplot(soak_max_comb_i2, aes(x = max_current_swv, y = max_current_gc)) +
    geom_point() + geom_smooth(data = soak_max_comb_i2 %>% filter(rep <
    10), method = "lm")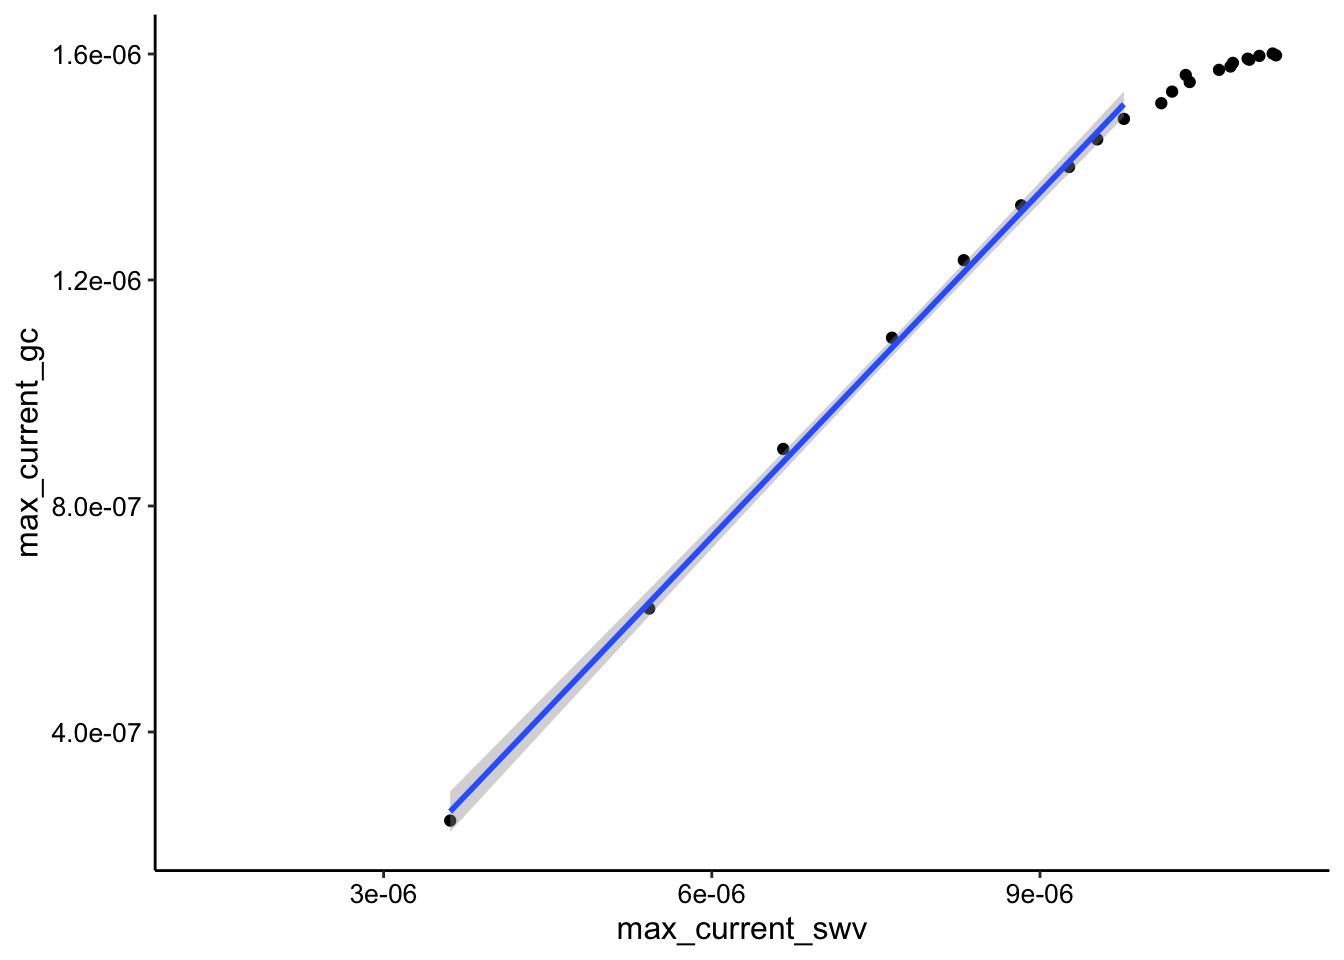
dap_from_swvGC <- function(m, t_p = 1/(2 * 300)) {

    psi <- 0.7
    # psi <- 0.75 A <- 0.013 #cm^2
    A <- 0.025  #cm^2
    S <- 18.4  #cm
    d_ap <- (m * A * psi)^2/(S^2 * pi * t_p)

    d_ap
}

lm_soak <- tidy(lm(max_current_gc ~ max_current_swv, data = soak_max_comb_i2 %>%
    filter(rep < 10)), conf.int = T) %>% filter(term == "max_current_swv") %>%
    mutate(dap = dap_from_swvGC(m = estimate)) %>% mutate(dap_high = dap_from_swvGC(m = conf.high)) %>%
    mutate(dap_low = dap_from_swvGC(m = conf.low)) %>% mutate(dataset = "SWVvsGC")
Transfer
tran_data_path = "../Data/Transfer/"
# divide swv into rep and subrep and then subtract 1 from rep
# to match with GC
SWV_tran_filenames <- dir(path = tran_data_path, pattern = "[swv]+.+[txt]$")

SWV_tran_file_paths <- paste(tran_data_path, SWV_tran_filenames,
    sep = "")

swv_tran_data_cols <- c("E", "i1", "i2")

filename_cols = c("echem", "rep")

swv_skip_rows = 18


swv_tran_data <- echem_import_to_df(filenames = SWV_tran_filenames,
    file_paths = SWV_tran_file_paths, data_cols = swv_tran_data_cols,
    skip_rows = swv_skip_rows, filename_cols = filename_cols,
    rep = T, PHZadded = F)

ggplot(swv_tran_data, aes(x = E, y = current, color = rep, group = rep)) +
    geom_path() + facet_wrap(~electrode, scales = "free") + scale_color_viridis() +
    scale_x_reverse()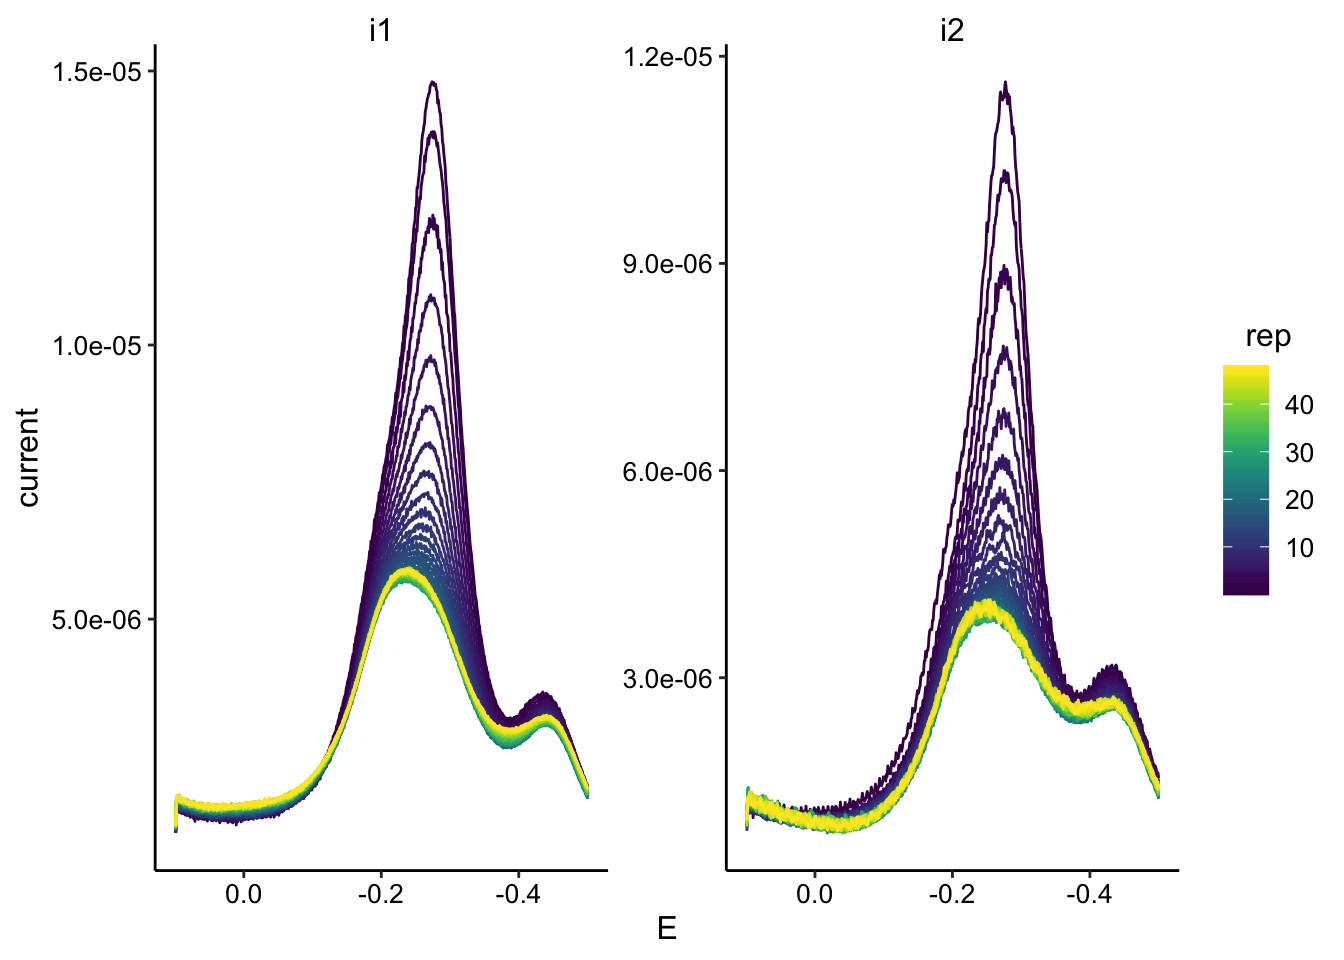
swv_tran_max <- swv_tran_data %>% group_by(rep, electrode) %>%
    filter(E < -0.15 & E > -0.35) %>% mutate(max_current = max(abs(current))) %>%
    filter(abs(current) == max_current)


ggplot(swv_tran_max, aes(x = minutes, y = max_current, color = electrode)) +
    geom_point()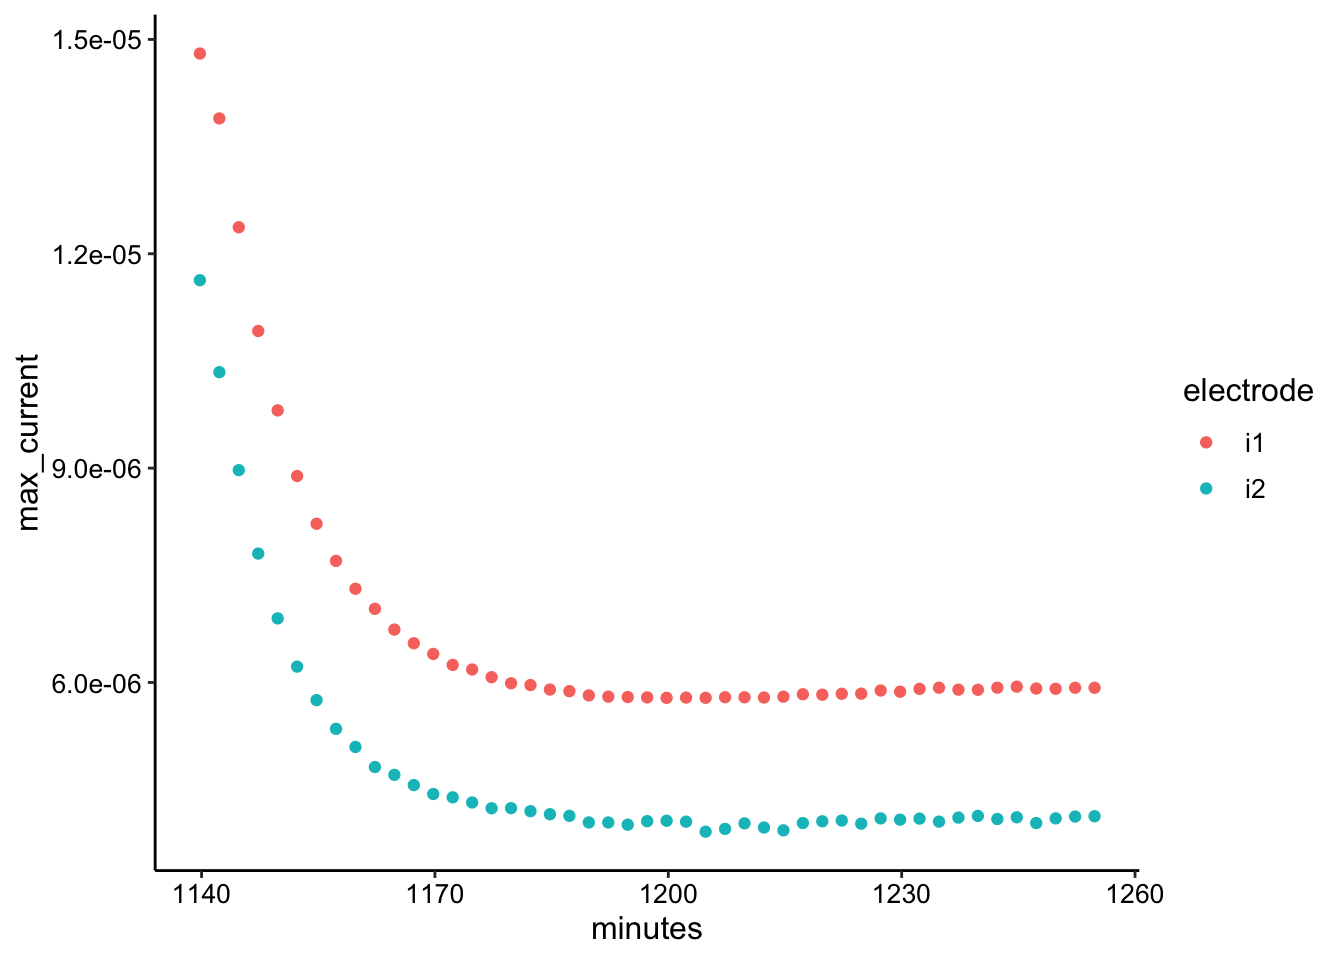
ggplot(swv_tran_data, aes(x = E, y = current, color = rep, group = rep)) +
    geom_path() + geom_point(data = swv_tran_max, aes(x = E,
    y = max_current), color = "red", size = 2) + facet_wrap(~electrode,
    scales = "free") + scale_color_viridis() + scale_x_reverse()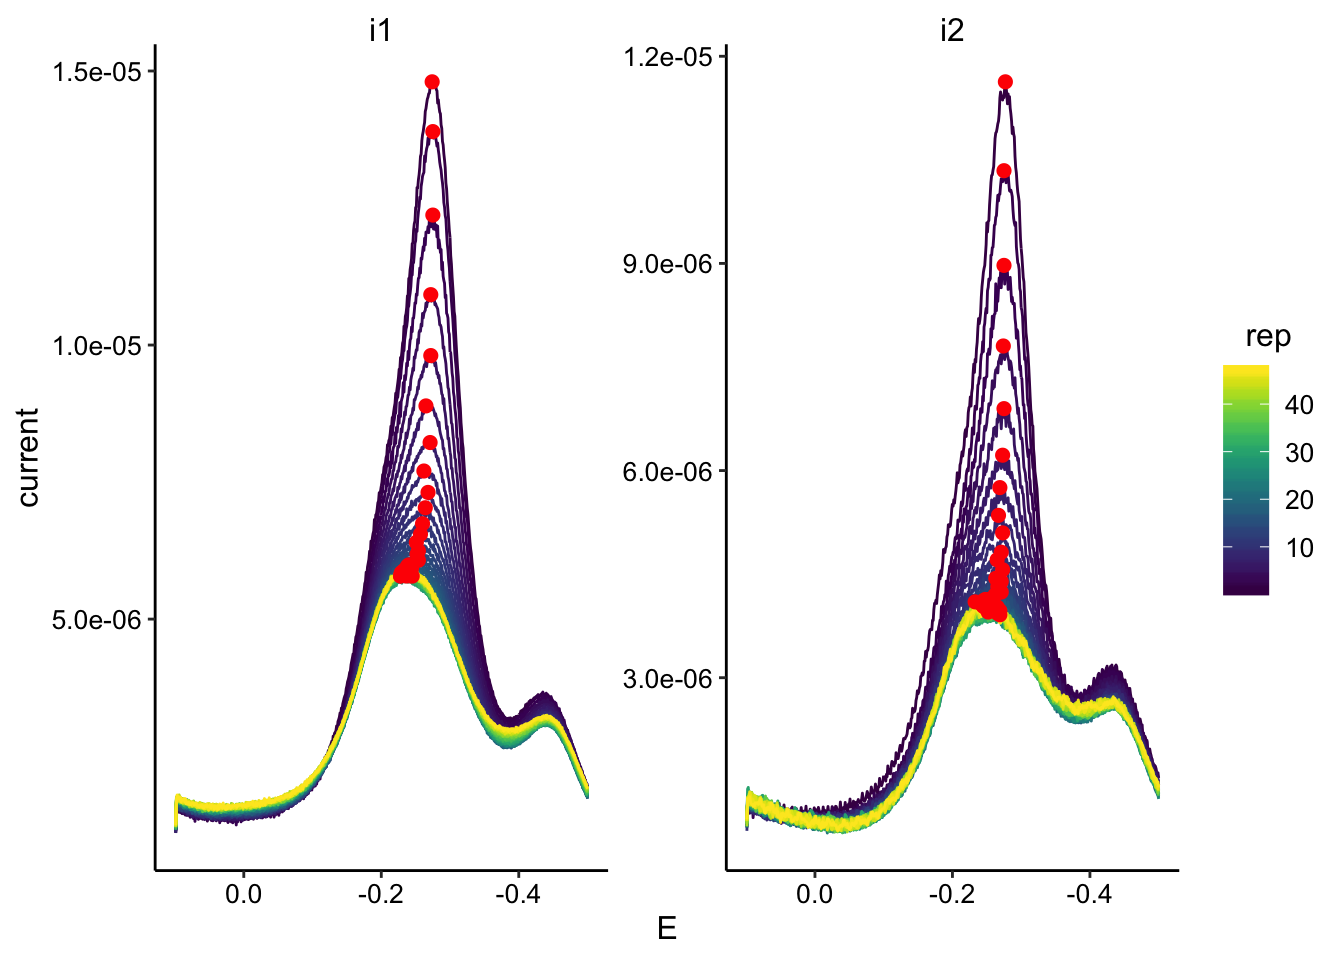
tran_data_path = "../Data/Transfer/"
# divide swv into rep and subrep and then subtract 1 from rep
# to match with GC
GC_tran_filenames <- dir(path = tran_data_path, pattern = "[gc]+.+[txt]$")

GC_tran_file_paths <- paste(tran_data_path, GC_tran_filenames,
    sep = "")

gc_tran_data_cols <- c("E", "i1", "i2")

filename_cols = c("echem", "rep")

swv_skip_rows = 21


gc_tran_data <- echem_import_to_df(filenames = GC_tran_filenames,
    file_paths = GC_tran_file_paths, data_cols = gc_tran_data_cols,
    skip_rows = gc_skip_rows, filename_cols = filename_cols,
    rep = T, PHZadded = F)

ggplot(gc_tran_data, aes(x = E, y = current, color = rep, group = rep)) +
    geom_path() + scale_color_viridis() + scale_x_reverse()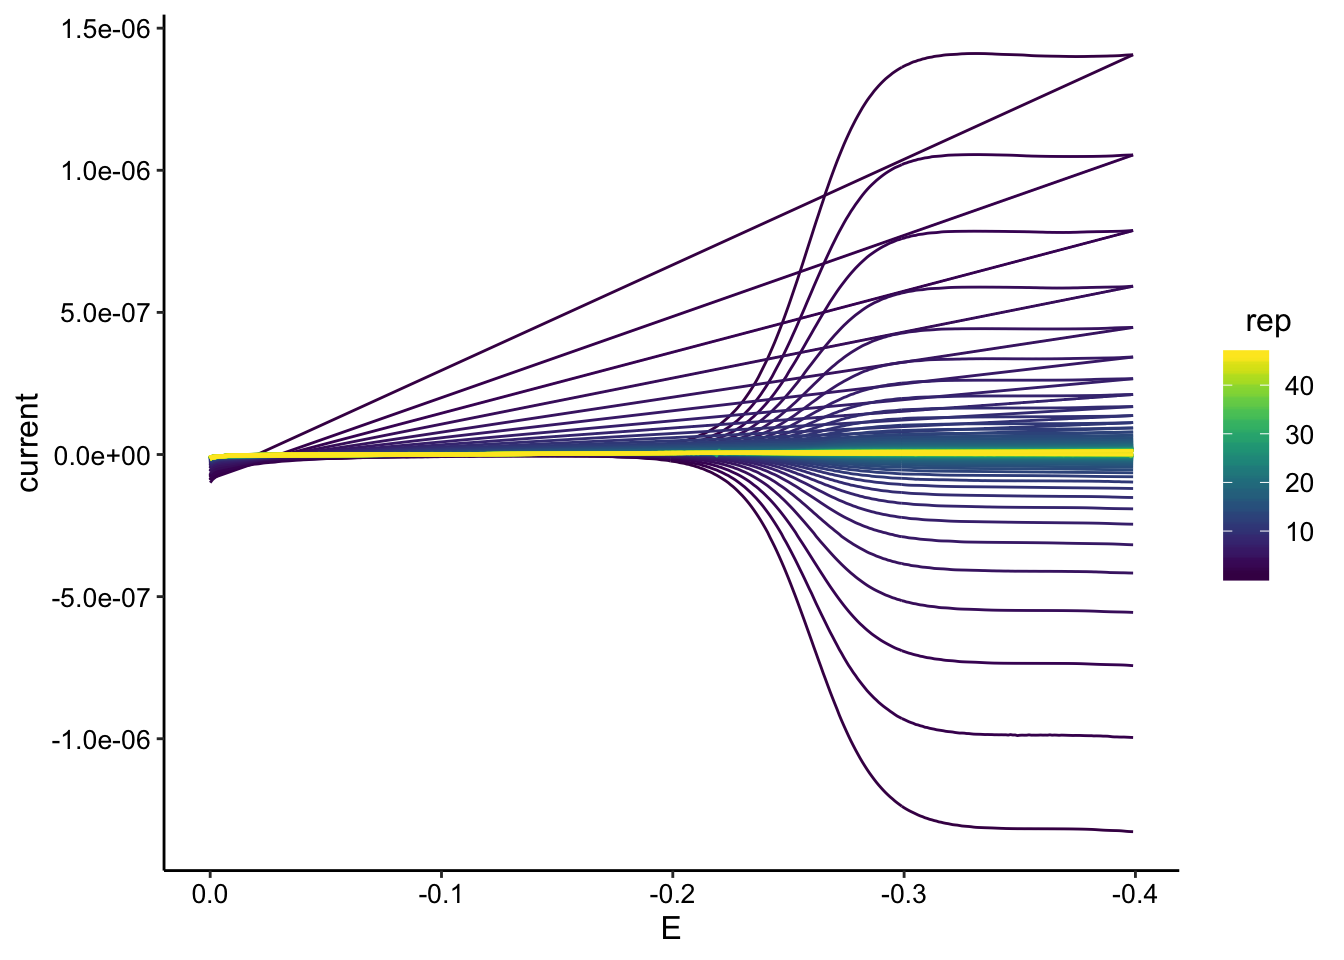
gc_tran_max <- gc_tran_data %>% group_by(rep, electrode) %>%
    filter(E < -0.15) %>% mutate(max_current = max(abs(current))) %>%
    filter(abs(current) == max_current)


ggplot(gc_tran_max, aes(x = minutes, y = max_current, color = electrode)) +
    geom_point()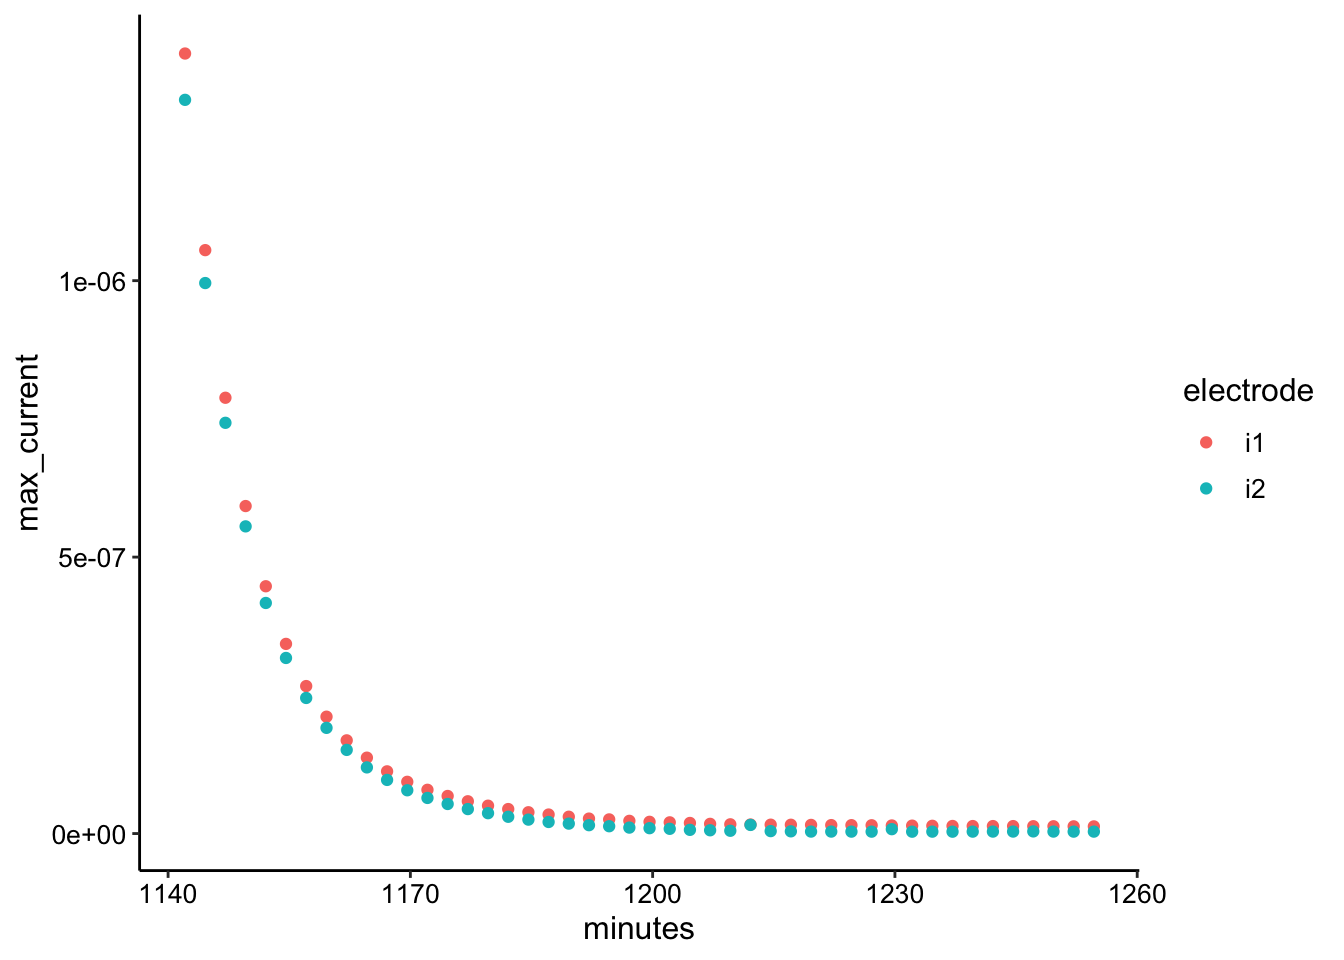
ggplot(gc_tran_data, aes(x = E, y = abs(current), color = rep,
    group = rep)) + geom_path() + geom_point(data = gc_tran_max,
    aes(x = E, y = max_current), color = "red", size = 2) + facet_wrap(~electrode) +
    scale_color_viridis() + scale_x_reverse()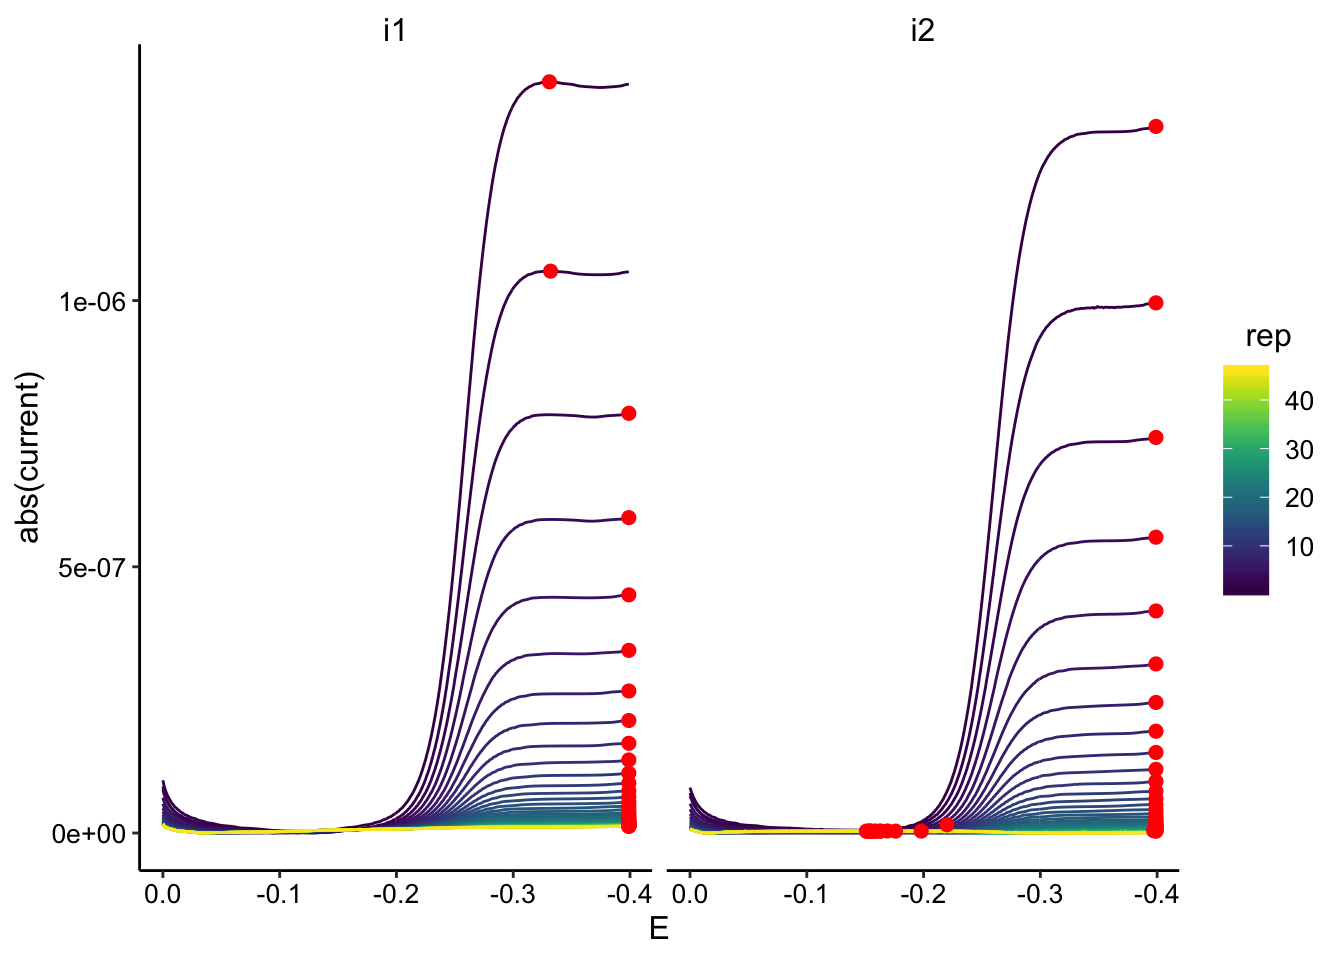
tran_max_comb_i1 <- left_join(swv_tran_max %>% ungroup() %>%
    filter(electrode == "i1") %>% mutate(rep = rep - 1), gc_tran_max %>%
    filter(electrode == "i2"), by = c("rep"), suffix = c("_swv",
    "_gc"))

tran_max_comb_i2 <- left_join(swv_tran_max %>% ungroup() %>%
    filter(electrode == "i2") %>% mutate(rep = rep - 1), gc_tran_max %>%
    filter(electrode == "i2"), by = c("rep"), suffix = c("_swv",
    "_gc"))

ggplot(tran_max_comb_i1, aes(x = max_current_swv, y = max_current_gc)) +
    geom_point() + geom_smooth(data = tran_max_comb_i1 %>% filter(rep <
    10), method = "lm")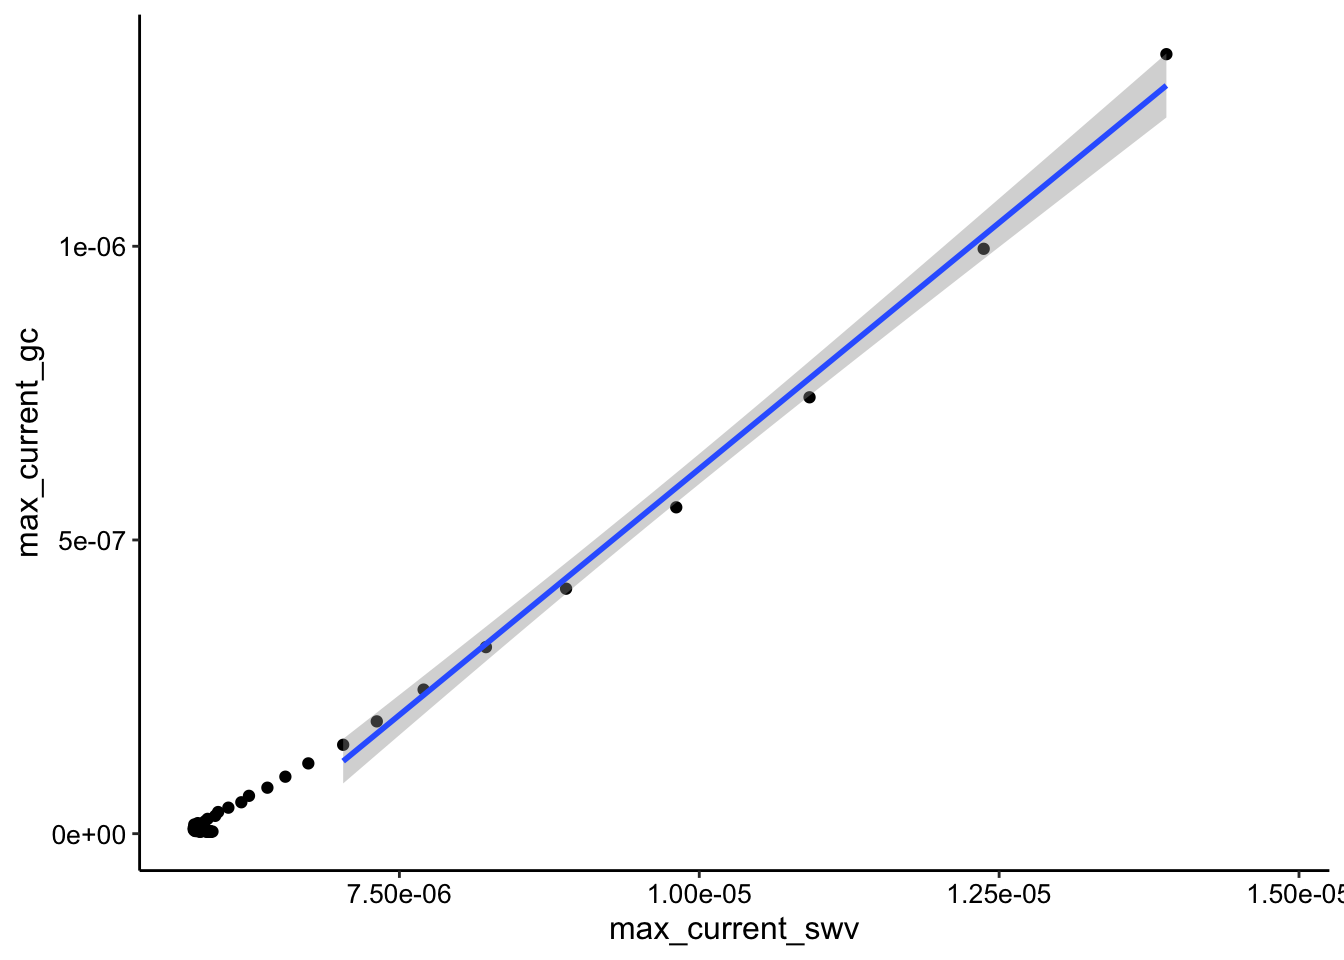
ggplot(tran_max_comb_i2, aes(x = max_current_swv, y = max_current_gc)) +
    geom_point() + geom_smooth(data = tran_max_comb_i2 %>% filter(rep <
    10), method = "lm")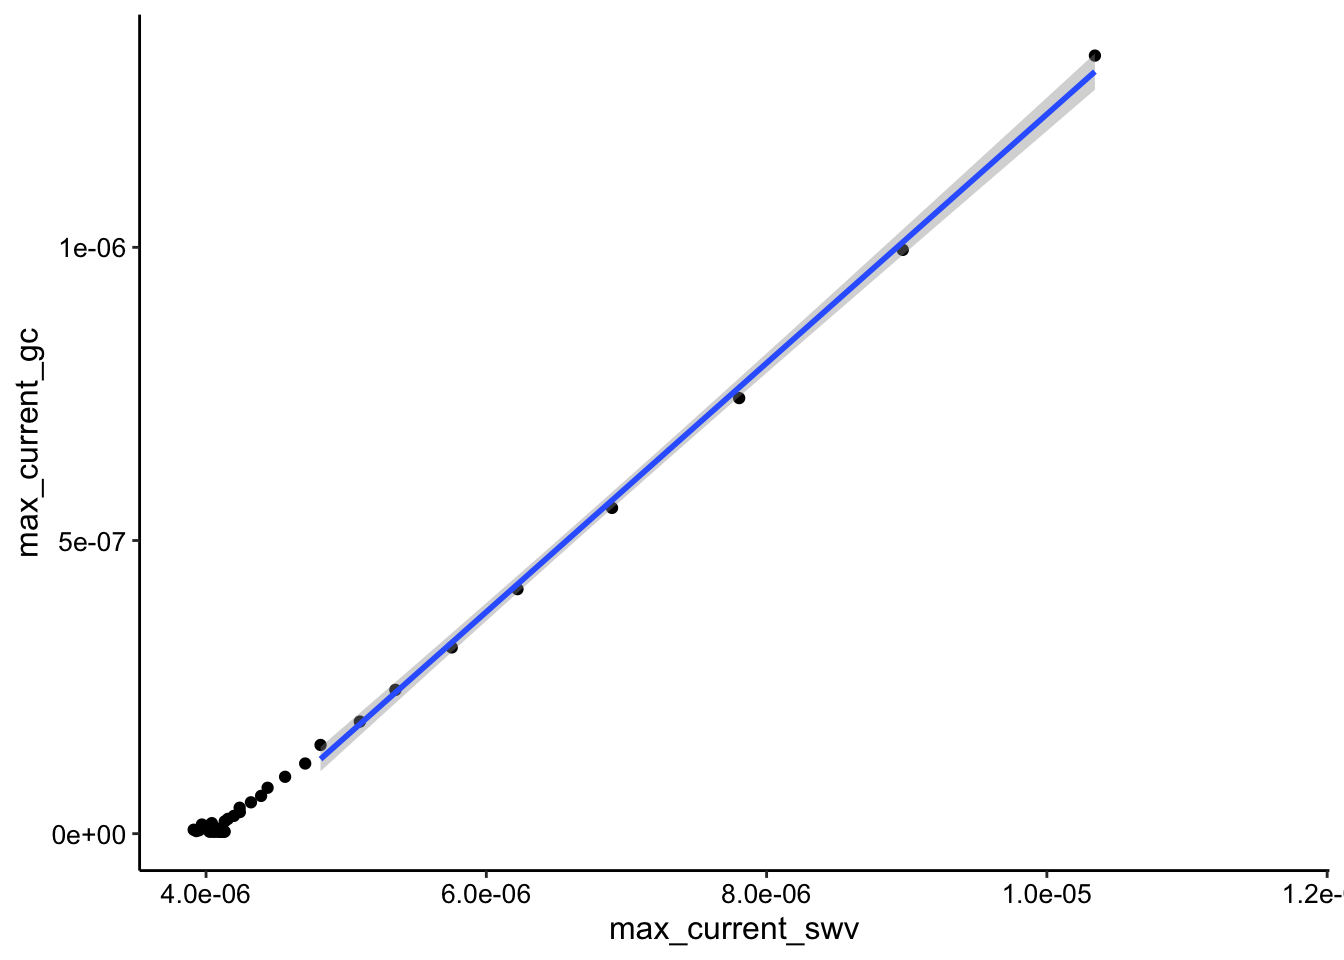
Still relatively curved.
lm_tran <- tidy(lm(max_current_gc ~ max_current_swv, data = tran_max_comb_i2 %>%
    filter(rep < 10)), conf.int = T) %>% filter(term == "max_current_swv") %>%
    mutate(dap = dap_from_swvGC(m = estimate)) %>% mutate(dap_high = dap_from_swvGC(m = conf.high)) %>%
    mutate(dap_low = dap_from_swvGC(m = conf.low)) %>% mutate(dataset = "SWVvsGC")
Output Files
# SWV
swv_max_agarose <- bind_rows(swv_tran_max %>% mutate(reactor = "transfer"),
    swv_soak_max %>% mutate(reactor = "soak"))

# write_csv(swv_max_ctDNA,
# '06_06_19_processed_swv_max_agarose.csv')

# GC
gc_max_agarose <- bind_rows(gc_tran_max %>% mutate(reactor = "transfer"),
    gc_soak_max %>% mutate(reactor = "soak"))

# write_csv(gc_max_ctDNA,
# '06_06_19_processed_gc_max_agarose.csv')

# SWV - GC
swvGC_agarose <- bind_rows(tran_max_comb_i1 %>% mutate(reactor = "transfer"),
    tran_max_comb_i2 %>% mutate(reactor = "transfer"), soak_max_comb_i1 %>%
        mutate(reactor = "soak"), soak_max_comb_i2 %>% mutate(reactor = "soak"))

# write_csv(swvGC_ctDNA,
# '06_06_19_processed_swvGC_agarose.csv')